Creating Stock Charts
Creating stock charts is the foundation of technical analysis in Stockalyze. This guide walks you through the process of creating both End-Of-Day (EOD) and intraday charts, selecting securities, and accessing your data.
Quick Start Video
Watch this video to quickly learn how to create stock charts in Stockalyze:
Step-by-Step: Creating Your First Stock Chart
Follow these steps to create a new stock chart:
Step 1: Select Chart Type
On the Stockalyze gateway window, click either:
- New EOD Chart — For end-of-day data with daily, weekly, monthly, or yearly timeframes
- New Intraday Chart — For intraday data with minute and hourly timeframes
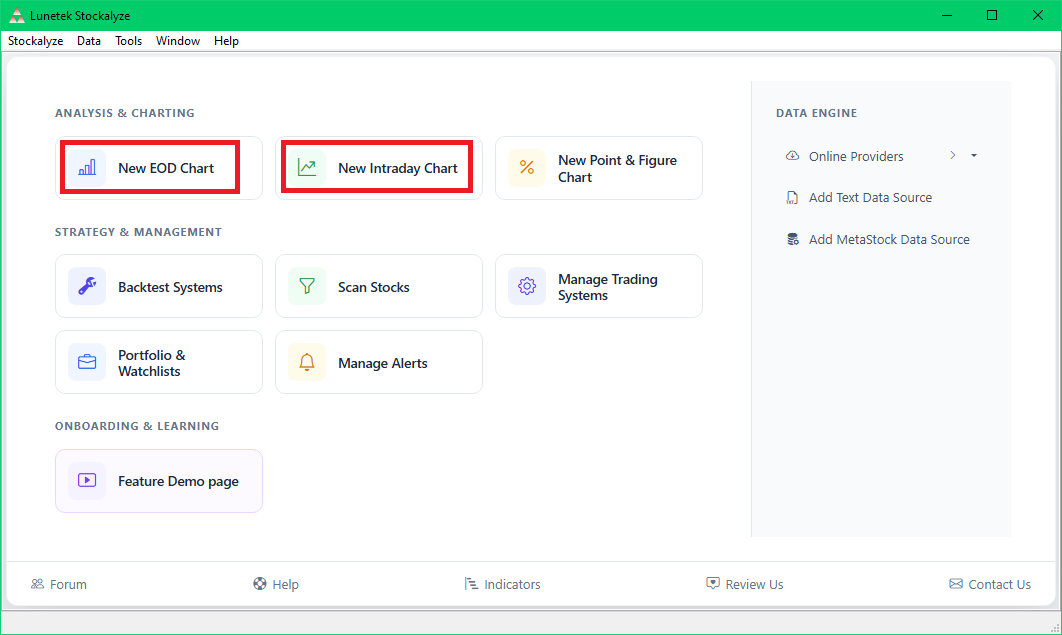
New Chart buttons on the Stockalyze gateway window
Step 2: Search for a Security
The Security Selection Dialog will appear. To find the stock you want:
- Type a ticker symbol or company name in the 'Search Ticker/Name' field at the top-left corner (e.g., AAPL, NASDAQ, or Apple)
- Select your desired country from the countries list if needed
- Stockalyze will display matching securities in the list below
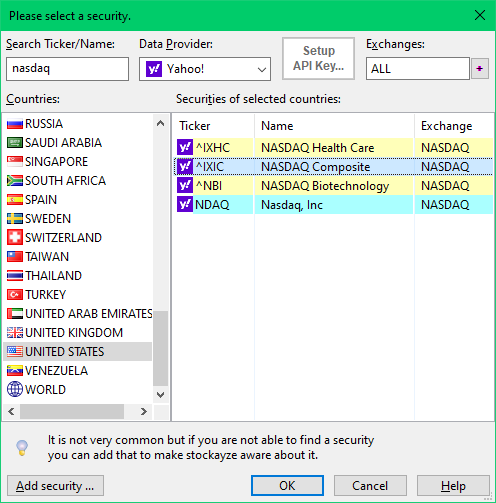
Searching for a ticker symbol or company name
Step 3: Select and Confirm
From the search results, select the desired security (e.g., NASDAQ Composite, AAPL, etc.) and click OK to create the chart.
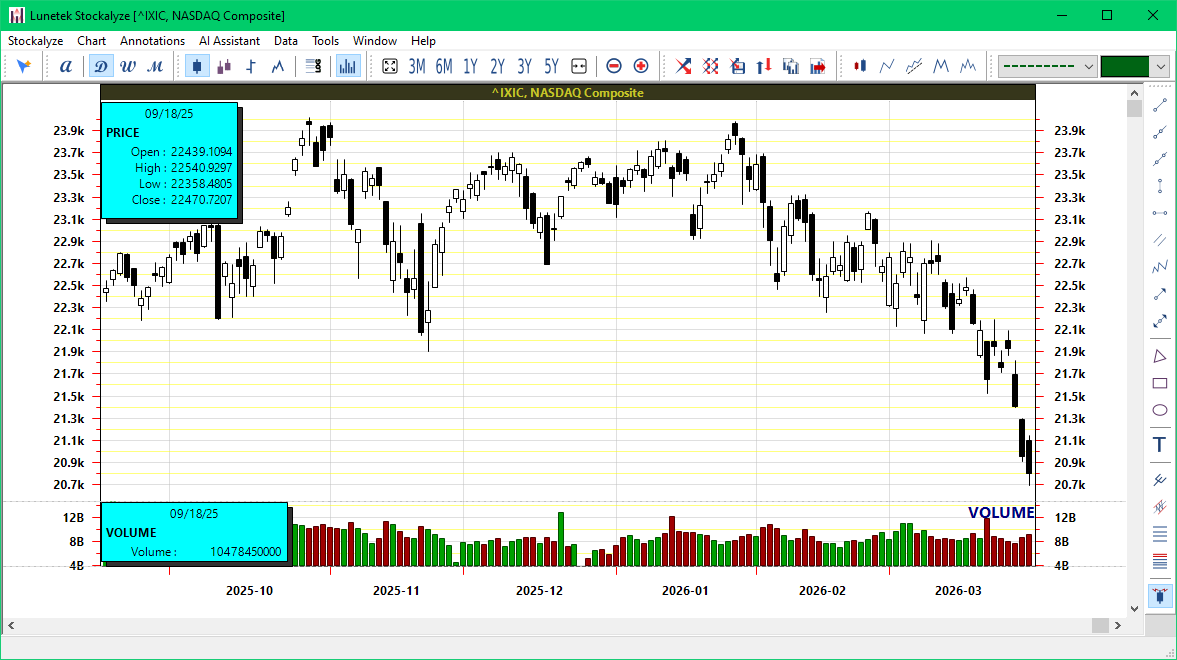
A newly created basic technical stock chart
Understanding Data Requirements
Note: An internet connection is required the first time you create a chart for any security, as Stockalyze downloads historical data. Previously downloaded data is cached locally, so subsequent uses only require updates. This means faster chart creation once the data is cached.
What's Next?
Once your basic stock chart is created, you can enhance it with:
- Technical Indicators — Add MACD, RSI, Bollinger Bands, and more
- Timeframes and Zoom — Switch between different time periods and zoom levels
- Indicator Templates — Save and reuse your favorite indicator configurations
- Annotations — Draw trend lines, support/resistance zones, and other technical drawings
- Pattern Detection — Automatically detect chart patterns like head and shoulders
EOD vs Intraday Charts
EOD (End-Of-Day) Charts
EOD charts display daily closing prices and are ideal for swing trading and long-term investors. These charts support multiple timeframes including daily, weekly, monthly, quarterly, and yearly views, allowing you to analyze trends over different periods.
Intraday Charts
Intraday charts display price movement within a single trading day or across multiple days with minute-level precision. These charts are ideal for day traders and are available in 1-minute, 5-minute, 15-minute, 30-minute, and hourly intervals.
Related Topics
- Stock Chart Guide — Complete overview of all charting features
- Security Selection Dialog — Detailed help for finding securities
- Chart Timeframes and Zoom — Learn how to adjust your view
 Stockalyze Help Manual