Stock Chart Annotations
Stock Chart Annotations are drawing tools that let you mark up your charts with trend lines, support/resistance levels, Fibonacci retracements, and other visual elements. These tools help you analyze chart patterns, mark key price levels, and highlight areas of interest.
What are Chart Annotations?
Chart annotations are manually drawn elements added to a chart to help with technical analysis. Unlike indicators which are automatically calculated, annotations are created by you to:
- Draw support and resistance levels
- Identify trend lines
- Mark price targets and entry/exit points
- Highlight chart patterns
- Add reference levels and analysis aids
- Add notes and labels
Available Annotation Tools
Stockalyze provides a comprehensive set of drawing and annotation tools:
| Annotation Type | Description | Best Used For |
| Trend Line | A straight line segment with fixed endpoints. Connect high-to-high or low-to-low points. | Drawing support/resistance, confirming trends |
| Ray | A line that extends infinitely in both directions from a point. No fixed endpoints. | Extending trend lines that continue indefinitely |
| Extended Line | A line fixed at one point and extends infinitely on the other end. | Projecting trend continuation, resistance targets |
| Vertical Line | Extends infinitely vertical but is always vertical (not diagonal). | Marking significant dates or events, dividing time periods |
| Horizontal Line | Extends infinitely horizontal at a specific price level. | Marking key price levels, round numbers, swing highs/lows |
| Parallel Lines | A set of parallel trend lines with the same angle. | Creating trading channels, visualizing price ranges |
| Connected Lines | Multiple trend lines connected at endpoints, creating a zigzag pattern. | Drawing complex patterns, marking multiple support/resistance levels |
| Arrow | A trend line with an arrow on one end. | Indicating direction of price movement or attention |
| Both Ways Arrow | A trend line with arrows on both ends. | Showing bidirectional movement or reversals |
| Triangle | A translucent triangle with opaque edge. | Highlighting triangle patterns, marking important areas |
| Rectangle | A translucent rectangle with opaque edge. | Marking consolidation zones, identifying trading ranges |
| Oval | A translucent ellipse with opaque edge. | Circling price action, highlighting reversals or patterns |
| Text | Add text labels directly on the chart. | Adding notes, labeling zones, explaining analysis |
| Andrew's Pitchfork | Three lines forming a pitchfork pattern. Used to detect early when price breaks from a trend. | Advanced trend analysis, predicting breakouts |
| Linear Regression | Calculates a trend line using linear regression. Can create channels around it. | Identifying statistical trends, creating trend channels |
| Fibonacci Retracements | Automatically draws Fibonacci levels based on swing highs and lows. | Identifying support/resistance, predicting retracement levels |
Accessing Annotation Tools
Method 1: Using the Annotation Menu
Go to Annotation menu and select the desired annotation type:
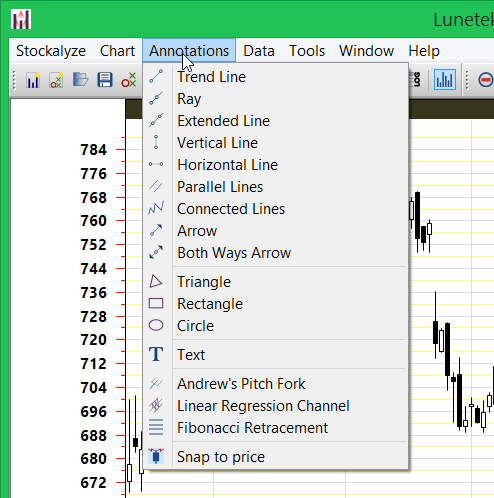
Annotation Menu showing all available drawing tools
Method 2: Using the Annotation Toolbar
Click on the desired tool button on the right side of the chart:
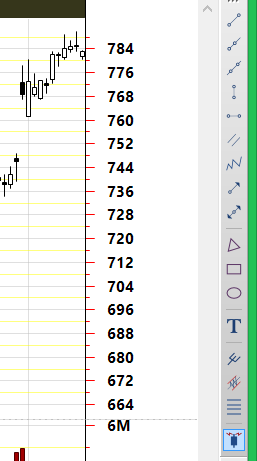
Annotation Toolbar on the right side of chart with drawing tools
How to Add Annotations to Your Chart
General Steps
- Select the annotation tool from the menu or toolbar
- Your cursor will change to indicate annotation mode
- Click on the chart at the starting point of your annotation
- For single-point or two-point annotations, click again for the ending point
- For multi-point annotations (connected lines, polygons), keep clicking to add points
- Right-click or press Enter when finished to complete the annotation
Practical Examples
Example 1: Drawing a Support/Resistance Line
Goal: Draw a horizontal line at a key price level
- Select Horizontal Line from the Annotation menu
- Click at the price level where you want the horizontal line (e.g., at 100.00)
- The horizontal line is instantly drawn across the entire chart at that price
- To adjust the price, right-click and select "Properties" to fine-tune the exact level
Example 2: Drawing a Trend Line
Goal: Connect swing lows to identify an uptrend support line
- Select Trend Line from the Annotation menu
- Click at the first swing low point
- Click at the second swing low point (which is higher than the first, showing uptrend)
- The trend line is drawn connecting both points
- You can now see if price touches this line for entry signals

Example: Trend line connecting swing lows
Example 3: Using Fibonacci Retracements
Goal: Identify potential pullback levels after a strong move
- Select Fibonacci Retracements from the Annotation menu
- Click at the starting point of a significant price move (e.g., a swing low)
- Click at the ending point of the move (e.g., a swing high)
- Stockalyze automatically calculates and displays Fibonacci levels (23.6%, 38.2%, 50%, 61.8%)
- Price often rebounds at these levels, providing entry/exit points
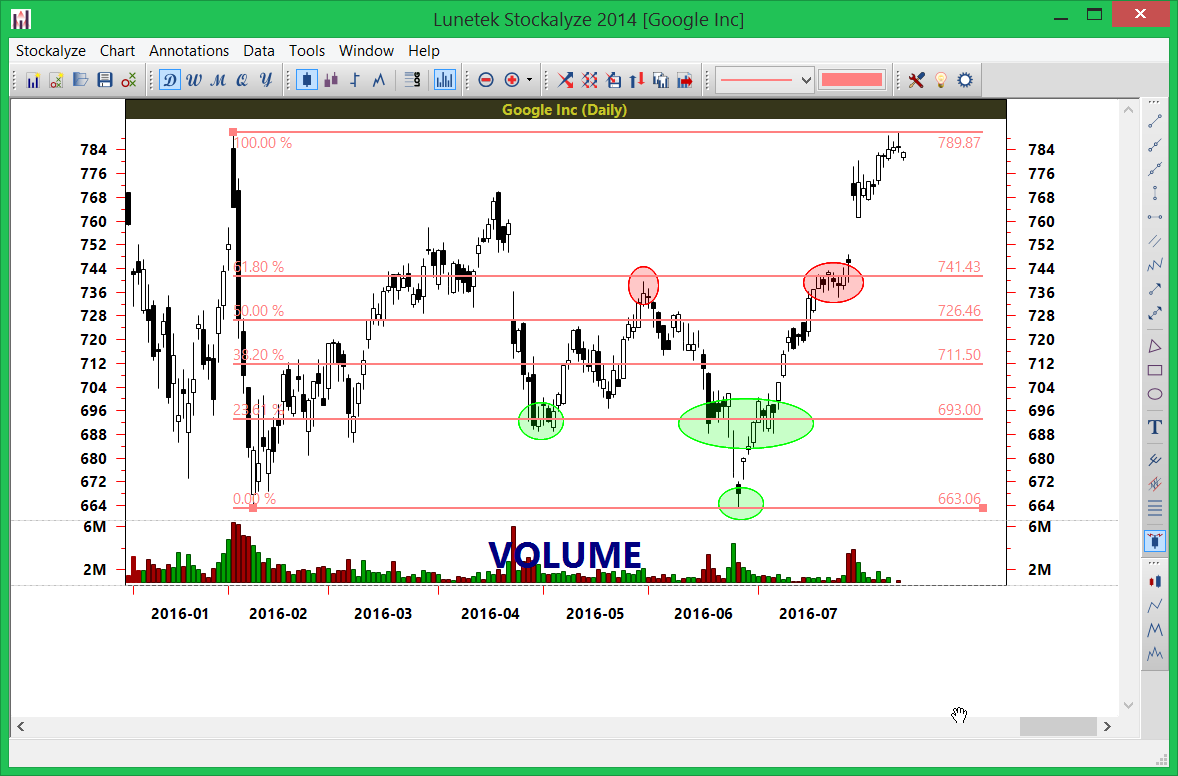
Fibonacci retracements applied to GOOG chart
Example 4: Creating a Trading Channel with Parallel Lines
Goal: Mark upper and lower boundaries of a consolidation range
- Select Parallel Lines from the Annotation menu
- Click at a swing low to start the first line
- Click at another swing low to set the angle
- Click to position the parallel line at a swing high
- You now have a channel showing the trading range
Example 5: Adding Text Labels
Goal: Label important chart patterns or notes
- Select Text from the Annotation menu
- Click at the location where you want the text
- Type your label (e.g., "Double Top", "Support Level", "Breakout Point")
- Press Enter to confirm
- The text appears on your chart for reference
Annotation Properties and Customization
Editing Annotation Properties
After creating an annotation, you can customize it:
- Right-click on the annotation to access properties
- Change color to match your preferences or color-code annotations
- Adjust line width to make important annotations more prominent
- Move or resize by dragging the annotation or its endpoints
- Delete annotations you no longer need
Advanced Annotation Techniques
Multi-Level Analysis
Use different colors for annotations at different levels:
- Red: Major resistance levels
- Blue: Major support levels
- Green: Potential entry points
- Gray: Outdated or secondary levels
Pattern Recognition
Use shapes to highlight potential chart patterns:
- Triangles for triangle chart patterns
- Rectangles for consolidation rectangles
- Ovals to circle potential head-and-shoulders patterns
Combining with Chart Patterns
Use annotations alongside automated pattern detection for comprehensive analysis.
Annotation Best Practices
- Keep it Clean: Don't overload your chart with too many annotations. Focus on key levels.
- Use Color Coding: Use consistent colors to quickly identify types of annotations
- Label Everything: Add text labels so you remember why you drew each annotation
- Update Regularly: Remove outdated annotations when they are no longer relevant
- Multi-Timeframe: Draw annotations on multiple timeframes to identify confluence zones
- Keep Notes: Consider adding text annotations explaining your analysis rationale
- Test Your Levels: Document whether your annotations correctly predicted support/resistance
- Combine with Indicators: Use annotations alongside technical indicators for confirmation
Saving Charts with Annotations
When you save a chart, all annotations are preserved:
- Use File → Save Chart to save your annotated chart
- Annotations are preserved when you reopen the chart later
- Export your chart with annotations as an image for sharing or archiving
Related Topics
- Stock Chart Guide — Overview of all charting features
- Chart Pattern Detection — Automate pattern recognition alongside manual annotation
- Technical Indicators — Use with annotations for complete analysis
- Creating Stock Charts — Basics of chart creation
 Stockalyze Help Manual