Indicator Templates
Indicator Templates are pre-configured sets of indicators and settings that you can save and reuse. Instead of manually adding the same indicators to every chart, create a template once and apply it multiple times. This saves time and ensures consistency across your technical analysis.
What are Indicator Templates?
An Indicator Template is a saved configuration file that contains:
- All indicators added to the chart
- Parameter settings for each indicator (periods, colors, etc.)
- Chart zone sizes and display settings
- Pattern detection settings
- Any composite indicators you've created
Once saved, you can apply this entire setup to any new chart, significantly speeding up your analysis workflow.
Benefits of Using Templates
- Time Savings: Add multiple indicators to a chart in one click instead of adding them individually
- Consistency: Maintain uniform indicator configurations across all your charts
- Standard Setups: Create different templates for different trading styles or timeframes
- Experimentation: Create templates and test them on historical charts before trading
- Team Collaboration: Share consistent analysis templates with other traders or team members
- Best Practices: Codify your proven indicator combinations into reusable templates
Creating a Template
Step 1: Create Your Ideal Chart Setup
- Create a new stock chart or open an existing one
- Add all the indicators you want to include in your template
- Configure each indicator with your preferred parameters and colors
- Add any pattern detectors you want to include
- Adjust zone sizes as desired
Step 2: Save as Template
- Once your chart is configured perfectly, go to Chart → Save Indicators as Template...
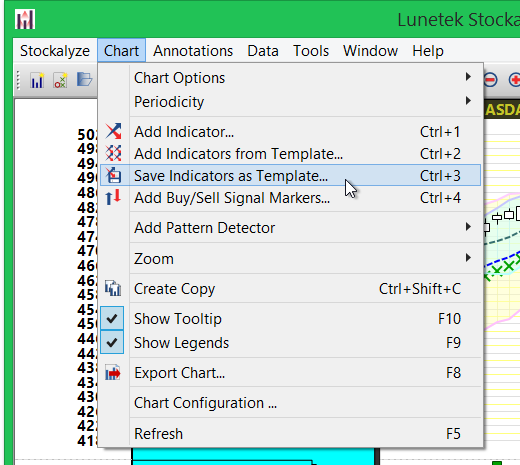
Save Indicators as Template menu item
Step 3: Name and Save
- A file dialog will appear
- Choose a descriptive name for your template (e.g., "Swing Trading Setup", "Day Trader MACD RSI", "Long-term Trend Analysis")
- Select a location to save your template file
- Click Save
Template Naming Best Practices
Use clear, descriptive names that indicate:
- Trading Style: "Day Trading", "Swing Trading", "Position Trading"
- Timeframe: "Daily Setup", "1-Hour Setup", "Weekly Analysis"
- Market Type: "Trending Market", "Range Trading", "Volatile Setup"
- Purpose: "Momentum Entry", "Trend Confirmation", "Mean Reversion"
Examples:
- "Swing Trading - MACD RSI Bollinger"
- "Day Trading 1H - Momentum Setup"
- "Long-term Trend Analysis"
- "Volatility Breakout Setup"
Applying a Template
Method 1: Apply to an Existing Chart
- With a chart open (any chart, any security), go to Chart → Add Indicator from Template...
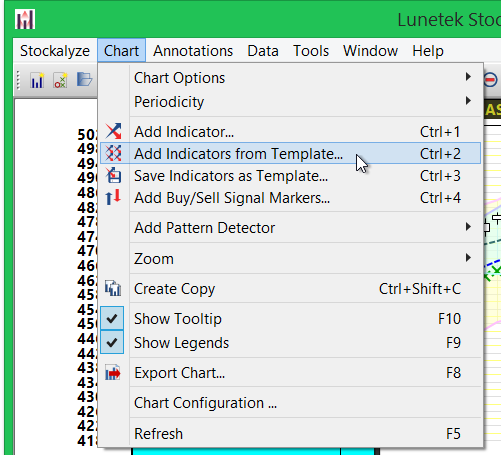
Add Indicator from Template menu item
- A file dialog opens
- Navigate to your template file and select it
- Click OK to apply
- All indicators, patterns, and configurations from the template are instantly applied to your chart
Setting a Default Template
You can designate one template as the default so that all newly created stock charts automatically include its indicators. This is powerful for ensuring consistency across all your analysis:
Setting Default Template
- Go to Preferences (usually Edit → Preferences or a similar menu)
- Find the "Chart Default Template" or similar setting
- Browse to and select your preferred template file
- Click OK to save preferences
When Default Template is Active
- Every new EOD chart created will automatically include your template's indicators
- Every new Intraday chart created will automatically include your template's indicators
- You can still manually add or remove indicators after creation
- You can temporarily disable the default template if needed by applying a different template
Project Ideas: Template Examples
Template 1: "Swing Trading Trend"
Purpose: Identify medium-term trends and entry points
Contents:
- 20-period and 50-period Moving Averages (trend)
- MACD (momentum and trend)
- RSI 14 (overbought/oversold)
- Volume indicator (confirmation)
Template 2: "Momentum Trader"
Purpose: Quick entry/exit for momentum plays
Contents:
- RSI 14 (momentum)
- MACD
- Stochastic Oscillator (additional momentum)
- Volume (confirmation)
Template 3: "Mean Reversion"
Purpose: Identify overbought/oversold conditions for reversal trades
Contents:
- Bollinger Bands (volatility and overbought/oversold)
- RSI 14 (confirmation)
- Average True Range (volatility check)
Template 4: "Breakout Trading"
Purpose: Detect and trade breakouts from consolidation
Contents:
- Bollinger Bands (defines consolidation range)
- Volume indicator (confirms breakout)
- ADX or Average Directional Index (trend strength)
- Zone detection settings
Template 5: "Multi-Timeframe Analysis"
Purpose: View multiple timeframes on one screen
Contents:
- Simple Moving Average (helps identify trend across timeframes)
- Parabolic SAR (identifies reversal points)
- Volume (universal indicator)
Managing Your Templates
Organizing Templates
Create a folder structure for your templates:
- Templates/Short-Term/ — Day trading and intraday templates
- Templates/Medium-Term/ — Swing trading templates
- Templates/Long-Term/ — Position trading and trend-following templates
- Templates/Experimental/ — New templates you're testing
Updating a Template
To update an existing template with new changes:
- Modify an existing chart (either from scratch or by applying and modifying a template)
- Go to Chart → Save Indicators as Template...
- Navigate to your template file and give it the same name (or save as new version)
- Choose to overwrite the existing file
Deleting a Template
Templates are just regular files. To delete:
- Use your file browser to navigate to where you saved templates
- Delete the unwanted template file
- Templates are independent, so deleting one doesn't affect others
Template Best Practices
- Start Simple: Create basic templates first, then create more specialized ones
- Test Thoroughly: Apply templates to various charts and market conditions before making them default
- Document Your Logic: In your template name, describe the purpose and market conditions
- Version Control: Keep versions of templates (e.g., "Trend Setup v1", "Trend Setup v2")
- Customize Per Chart: Templates are starting points; feel free to add/remove indicators for specific analysis
- Review Periodically: Revisit templates quarterly and update based on what's working
- Share Setups: Share template files with other traders for feedback and collaboration
Advanced Template Usage
Creating Context-Specific Templates
Consider creating templates for specific contexts:
- Market Condition Templates: Different setups for trending vs. sideways markets
- Security Type Templates: Different setups for stocks, ETFs, crypto, forex
- Session Templates: Different setups for opening hour vs. midday vs. closing
- Strategy Templates: Implementations of specific trading strategies (pullback trading, breakout trading, etc.)
Combining Templates
You're not limited to one template per chart:
- Create a base chart with your default template
- Apply a secondary template using Chart → Add Indicator from Template...
- This combines indicators from both templates on a single chart
- Useful for comparing two different analysis approaches
Related Topics
- Stock Chart Guide — Overview of all charting features
- Technical Indicators — Learn about available indicators
- Composite Indicators — Create advanced indicator combinations for templates
- Creating Stock Charts — Basics of chart creation
 Stockalyze Help Manual