Technical Analysis & Backtesting Software for Stock Traders and Investors
Stockalyze helps investors analyze stocks using powerful charts, indicators, and trading systems.

A free & professional technical analysis software and trading strategy development platform.
Charts Indicators AI-Powered Stock Chart Interpretation Point and Figure Charts Visual Trading Systems Backtesting Stock Screener Portfolio Tracking Alerts.
Everything You Need for Successful Investment
Professional-grade tools to make better decisions.
Advanced Technical Charts
Over 100+ technical indicators including MACD, ADX, RSI, SAR, Bollinger Bands, and more. Customize charts with multiple timeframes and drawing tools. Create composite indicators with simple drag and drop operation.
AI Trading Assistant & Analyst
Experience AI assisted chart analysis with Stockalyze. Leverage ChatGPT, Gemini, Claude and other free AI tools for technical analysis to interpret complex market trends and receive instant AI stock chart analysis insights for smarter trading and investment decisions.
Visual Trading Systems
Create and backtest Trading Systems without coding. Visual editor makes it easy to build complex trading systems in minutes.
Point and Figure Charts
Point and Figure charts are a powerful tool for technical analysis. They filter out market noise and focus on price movements.
Backtesting
Backtest your Trading Systems with historical data. Test multiple Trading Systems simultaneously with multiple stocks. Test with daily, weekly, or monthly data. Also, use stop-loss and stop-drawdown features to manage risks.
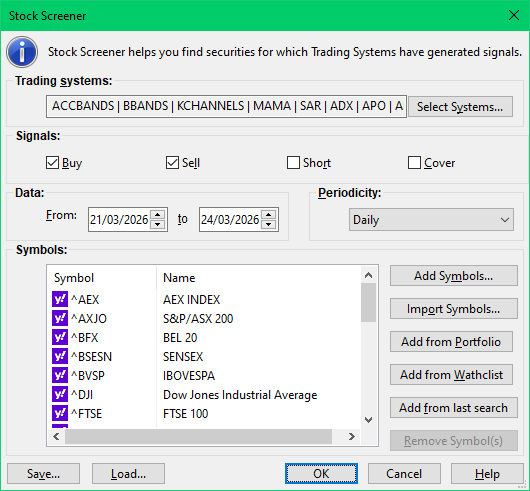
Stock Scanner
Scan thousands of stocks in seconds to find the ones that match your criteria. Filter using Trading Systems for buy, sell, short, or cover signals.
Portfolio Tracking
Track your investments and monitor your portfolio performance. Use alerts to stay informed of price changes and signals from Trading Systems.
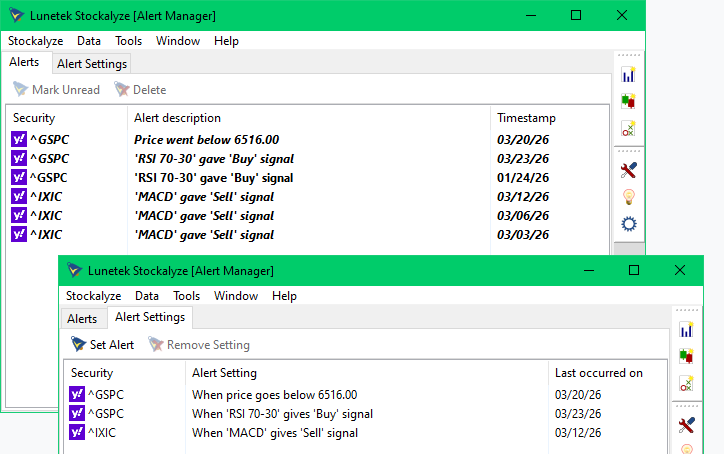
Alert System
Set up intelligent alerts based on price levels, indicator values, or complex Trading Systems. Get notified instantly when your custom conditions are met and never miss a trading opportunity.
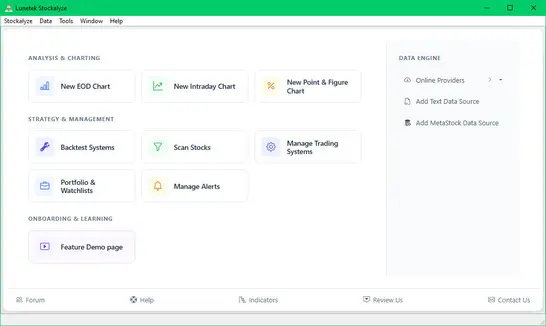
Powerful Technical Analysis and Backtesting Features
Stockalyze is a comprehensive technical analysis software for stock traders and investors. It combines advanced charting, AI Assistant, indicators, trading systems, backtesting, stock scanner, portfolio management and alert tools in one powerful platform.
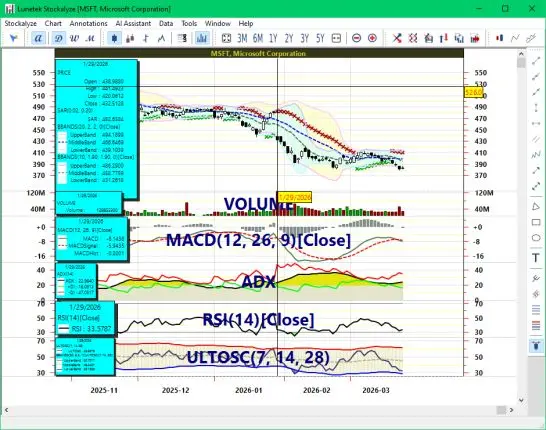
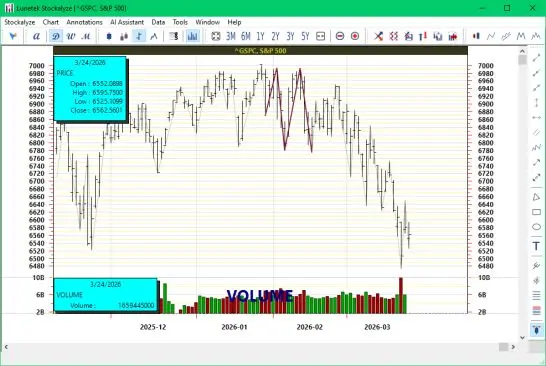
Technical stock chart
As a technical analysis software, Stockalyze is also a charting software. Creating high quality stock charts is one of the strength of Stockalyze.
- Technical Chart: Create Technical chart of EOD (End of day) stock price data.
- Many indicators: Moving Averages, Bollinger Bands, MACD, ADX, RSI, MFI and more than 50 other technical indicators.
- Ability to create composite indicators by simple drag-drop operation.
- Indicator parameters including its graphics can be easily configured.
- Stockalyze is a desktop application and so it works offline too. Once you have analyzed a stock while online the data is seemlessly saved locally, allowing you to analyze the same asset even when you go offline.
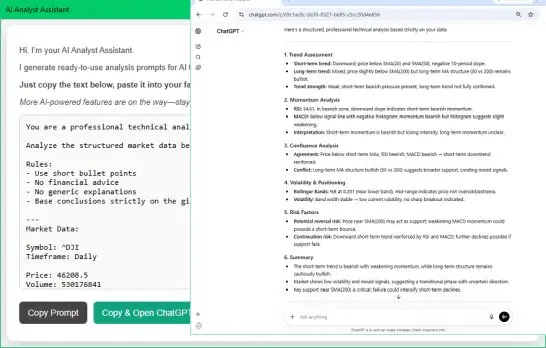
Advanced AI Stock Chart Analysis
Stockalyze bridges the gap between traditional indicators and modern AI assisted chart analysis, making it easy to use ChatGPT, Gemini, Claude or any other AI tool for AI-powered technical analysis and automated chart interpretation.
- AI Stock Chart Analyst Assistant: Stockalyze transforms structured market data into optimized prompts, providing a seamless AI assisted chart analysis experience for any financial chart.
- One-Click AI Integration: Instantly copy precise technical data and launch ChatGPT, Gemini, or Claude to get professional-grade AI stock chart analysis in seconds.
- Zero-Cost Future-Proofing: Our commitment is to keep AI for technical analysis accessible. New features, like the AI Portfolio Analyst, will continue to leverage low or zero-cost AI tools.
For more information, see our AI Stock Chart Analysis - Help Guide.
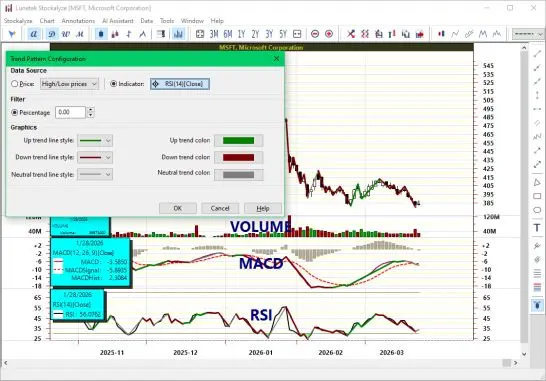
Trend Visualization
Quickly visualize trends in price movements or indicators.
- Simple trend visualization: One click lets you instantly see the trend of any price series.
- Strict trend definitions: Trend visualization follows precise higher-high-higher-low and lower-high-lower-low rules to reliably identify trends.
- Optional noise filter: Apply a non-zero filter value to reduce market noise and highlight meaningful trends.
- Visualize indicator trends: Easily select any indicator curve to see its trend with a simple mouse action.
- Zig-zag pattern recognition: Trend visualization also identifies zig-zag patterns, helping you spot potential reversals and key support/resistance levels.
For more information, see our Trend Visualization - Help Guide.
Trading Systems
Discover your favorite trading strategy using Stockalyze.
- Stockalyze has many built-in trading systems that you can use to evaluate your trading strategies.
- A trading system can be used to generate buy/sell signals.
- It can also be used in System Tester (backtesting) to see how a strategy would have worked in the past.
- Trading System is also used to find stock ideas using Stock Screener.
- While setting alert on a stock you can use Trading System to catch the investment opportunities on time.
For more information, see our Trading Systems - Help Guide.
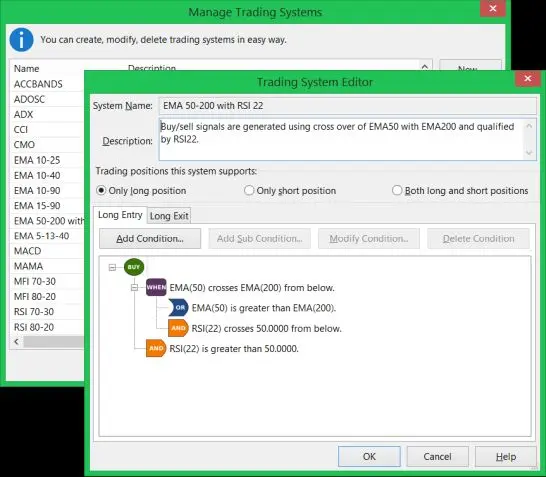
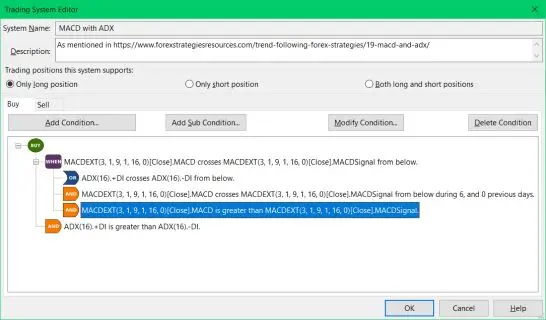
Visual Trading Systems Editor
Define your entry/exit rule visually.
- Visual Trading System Editor allows to define Trading Systems without use of formula or programming language.
- You can define your own Trading Systems using easy to use graphical user interface (GUI).
- Use your newly created Trading Systems to backtest, scan stock ideas, and plot buy-sell signals on chart.
For more information, see our Creating a new Trading System - Help Guide.
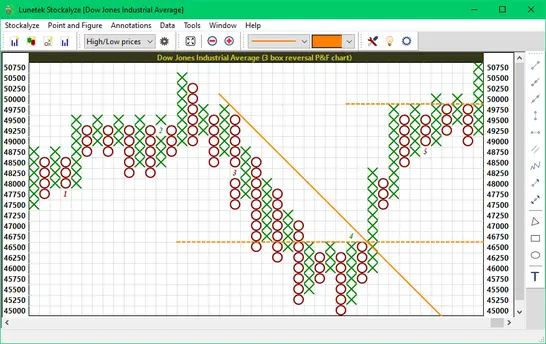
Point and Figure chart
Find breakout, support and resistance using Point and Figure chart.
- Point and Figure chart: Create Point and Figure chart with tier based box sizes.
- Can be used to detect buy/sell signals
- Support and resistance can be easily detected
- Stockalyze P&F uses tier based box sizes
- P&F parameters are fully configurable including base box size and reversal threshold
- You can add various annotations on P&F chart
For more information, see our Point and Figure Chart - Help Guide.
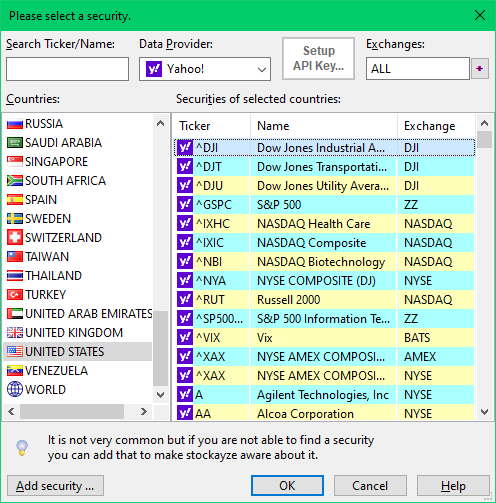
Works out of the box
Start using Stockalyze immediately after install.
- No configuration is needed.
- Free data download: Built-in feature of downloading free stock price data from Yahoo!, Tiingo, and Alphavantage.
- Built-in data downloader can download stock price for 37 countries and 50 stock exchanges world wide. So, no matter where you live there is a great chance you can use Stockalyze for your investment needs.
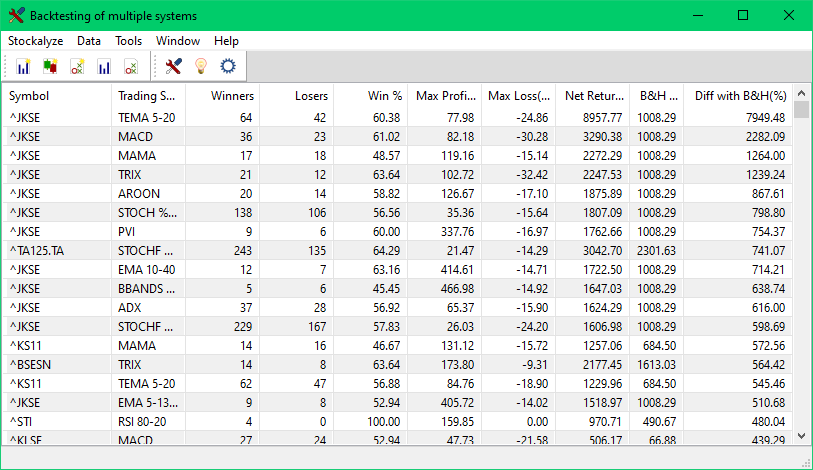
System Tester
Backtest your trading strategy.
- You can test Trading Systems on past data to know effectiveness of an investment strategy.
- Multiple strategies can be tested with multiple stocks in one go.
- Test can be run on your chosen range of past data, by default last 10 years of data is used.
- Other parameters like stop-loss and stop-profit-erosion too can be configured to suit your style.
- Even the timeframe of data, like Daily, Weekly, etc., can be changed before test is run.
Stock Screener
Find investment ideas that suit your strategy.
- Use it to scan/explore stock ideas from a list of stocks of your choice.
- Stock Screener can be used to find Buy, Sell, Short and Cover signals.
- You can look for signals that might have happened in last many trading sessions, by default only last day is scanned for stock ideas.
- Timeframe of data, like Daily, Weekly, etc., can also be changed before Stock Screener is run.
Pattern Detection
Take help in investment decisions from stock price patterns.
- Stockalyze can detect candlestick patterns like Abandoned Baby, Hanging Man, Harami, etc. these are more than 60 in total.
- Patterns formed by price movements can also be detected, e.g. Double Top/Bottom, and head & shoulders.
- Price movements can be simplified as Zig-zag so that patterns can also be detected by visual inspection
- Patterns can be detected in different timeframes, like Daily, Weekly, etc.
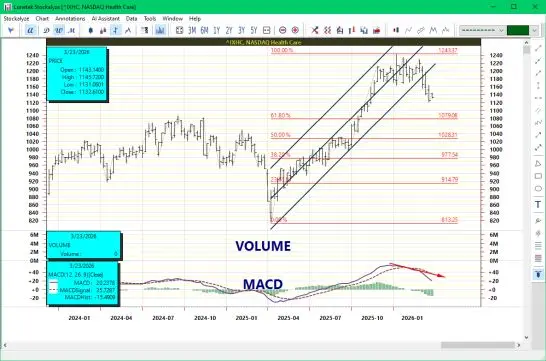
Annotations
Annotate technical chart like a pro.
- You can add trend-lines, ray, triangle, rectangle, oval, texts, and many other annotation objects on chart.
- You can also add advanced annotations like Andrew"s Pitch fork, Fibonacci retracements, and Linear Regression channels.
- Graphic properties of annotations like color and line-style can be easily modified.
Portfolio and Watchlist
Keep your eye on your investments and watchlists.
- Easily monitor all your investments.
- Create multiple portfolios.
- Also see the consolidated view of all portfolios.
- Quickly analyse gains-losses and performance.
- Create multiple Watchlists.
- Set alerts based on price and Trading Systems on stocks of portfolios and watchlists.
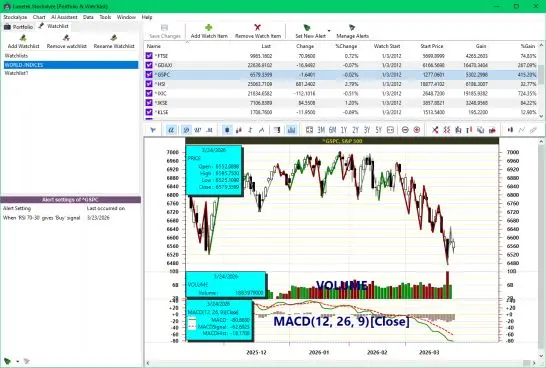
Alert System
Never miss an investment opportunity and get alerted.
- You can set alert based on Trading Systems and/or price so that you don"t miss the investment opportunity.
- When stockalyze is started it evaluates for all possible alerts that might got triggered.
- Alerts are also evaluated when new price data is available.
- At one place you can see consolidated list of all alerts that have occurred.
Easy to use
Stockalyze is easy to use by design.
- Stockalyze is designed as easy-to-use software
- Stockalyze is not just another technical analysis software. It is more than that. It is a toolkit that has many tools like Point & Figure, Portfolio & Watchlist, Alert, System Tester (aka Backtesting), stock-screener (aka scanner), apart from Technical Chart and many other features.
- Unlike other technical analysis softwares (including the leaders) Stockalyze does not throw unnecessary dialogs.
- Even the Trading System can be defined using Graphical User Interface (GUI) instead of complicated programs.
- The default values in many dialogs usually works in most of the cases.
Start Technical Analysis in 3 Simple Steps
Get up and running in less than 2 minutes.
Download
Click the download button to get the installer. Small file size (~40 MB) downloads in seconds.
Install
Double-click the installer and follow the simple prompts. No technical knowledge required.
Start Analyzing
Launch Stockalyze and start analyzing stocks immediately. All features ready to use.
Choose Your Plan
Start free, upgrade when you need advanced features.
Lite
FREE
Unlimited access to basic tools
Limited access to advanced tools
Perfect for beginners
Download FreePro
$49.99 one-time
Limited relaunch price
Frequently Asked Questions
Everything you need to know before getting started with Stockalyze
Still have questions?
Contact our support teamReady to Elevate Your Trading?
Download the free version now and start making better decisions.