Stock Chart Pattern Detection
Pattern detection tools automatically identify common chart patterns in price movements. Instead of manually scanning for patterns, Stockalyze can find zigzag patterns, double tops/bottoms, and head & shoulders formations for you. This guide explains how to use automatic pattern detection to enhance your technical analysis.
What is Chart Pattern Detection?
Chart pattern detection is an automated feature that scans price movements and identifies pre-defined patterns. These patterns often signal potential trading opportunities:
- Reversal Patterns: Double Top, Double Bottom, Head & Shoulders — these often signal trend reversals
- Trend Patterns: Zigzag patterns — help visualize underlying trends by filtering noise
- Automatic Highlighting: Once detected, patterns are visually highlighted on your chart
- Historical Recognition: Patterns are detected retroactively on historical data
Patterns Supported by Stockalyze
1. Zigzag Pattern
What it is: The Zigzag pattern filters out minor price fluctuations and highlights significant price movements.
How it works: It removes price moves smaller than your specified threshold (e.g., 2.5%) and connects the remaining significant highs and lows with lines.
Best used for:
- Visualizing underlying trends beneath market noise
- Identifying support and resistance levels
- Understanding price structure and momentum
- Filtering out false signals from minor fluctuations
Example:
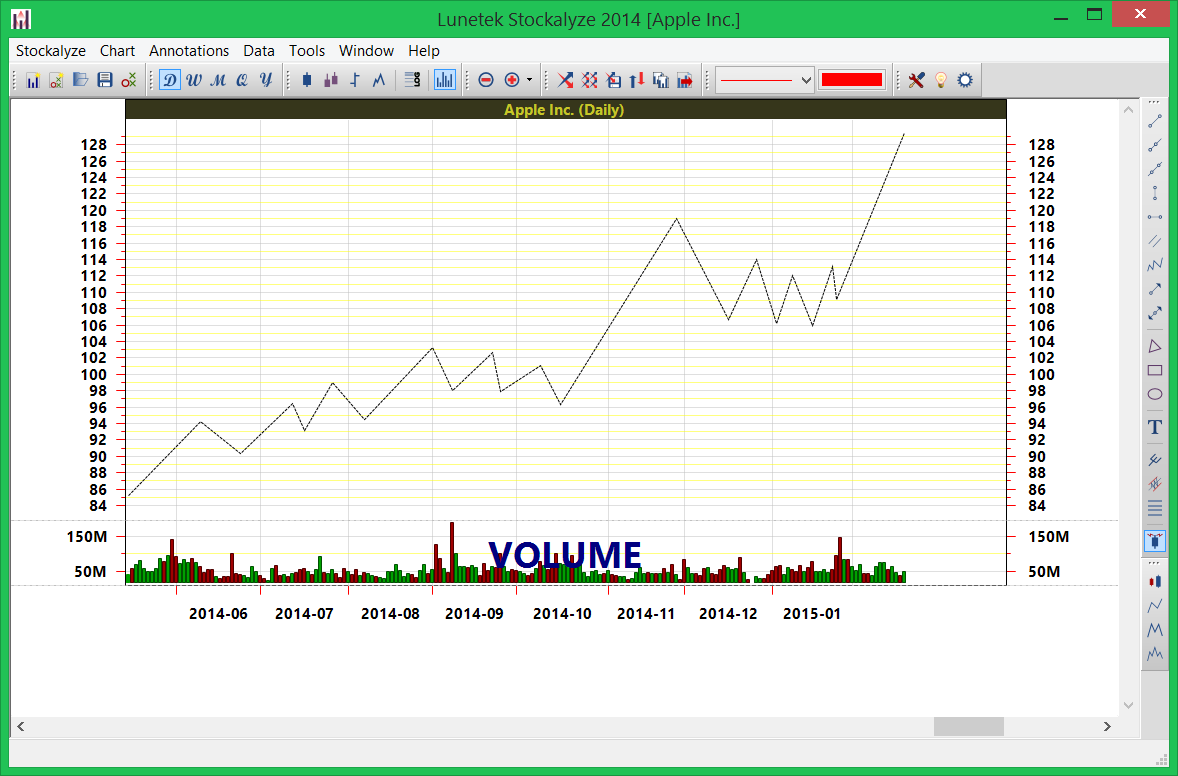
Zigzag pattern applied to AAPL with 2.5% threshold — notice how it connects significant moves and filters daily noise
2. Double Top and Double Bottom Patterns
What they are: Double Top and Double Bottom are reversal patterns that often signal trend changes.
Double Top Pattern:
- Occurs after an uptrend when price reaches a high, pulls back, and then reaches approximately the same high again
- Often signals the end of an uptrend and a potential downtrend beginning
- The area between the two tops is called the "neckline" — breaking below it can confirm the reversal
Double Bottom Pattern:
- Occurs after a downtrend when price reaches a low, bounces up, and then returns to approximately the same low
- Often signals the end of a downtrend and a potential uptrend beginning
- Breaking above the neckline (between the two bottoms) can confirm the reversal
Example:
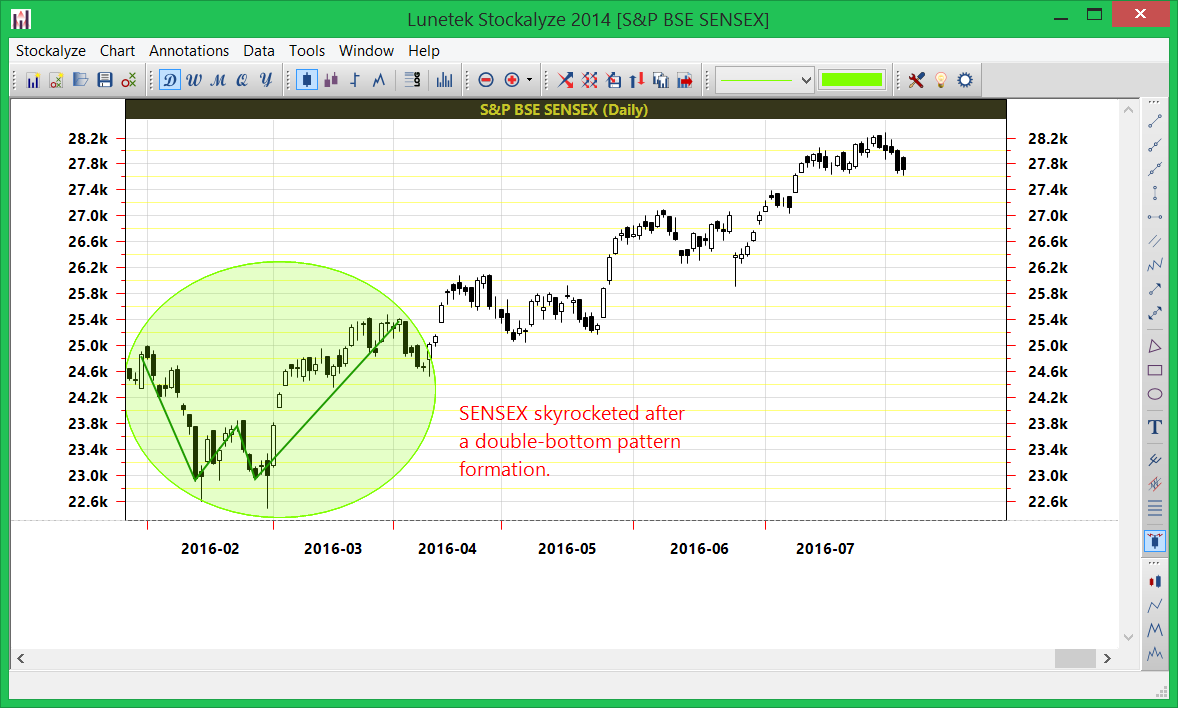
Double bottom pattern detected on SENSEX on March 2, 2016 — followed by significant upward movement
3. Head and Shoulders Pattern
What it is: The Head and Shoulders is a powerful reversal pattern consisting of three peaks: left shoulder, head (higher), right shoulder (lower than head).
Normal Head and Shoulders:
- Appears after an uptrend
- Left shoulder and right shoulder are at similar heights
- The head is higher than both shoulders
- Signals a potential trend reversal to downside
- The neckline (connecting the bottoms between shoulders) is often used as a target
Inverted Head and Shoulders:
- Appears after a downtrend with the pattern inverted
- Signals a potential trend reversal to the upside
- Left shoulder and right shoulder are at similar depths
- The head is lower than both shoulders
Example:
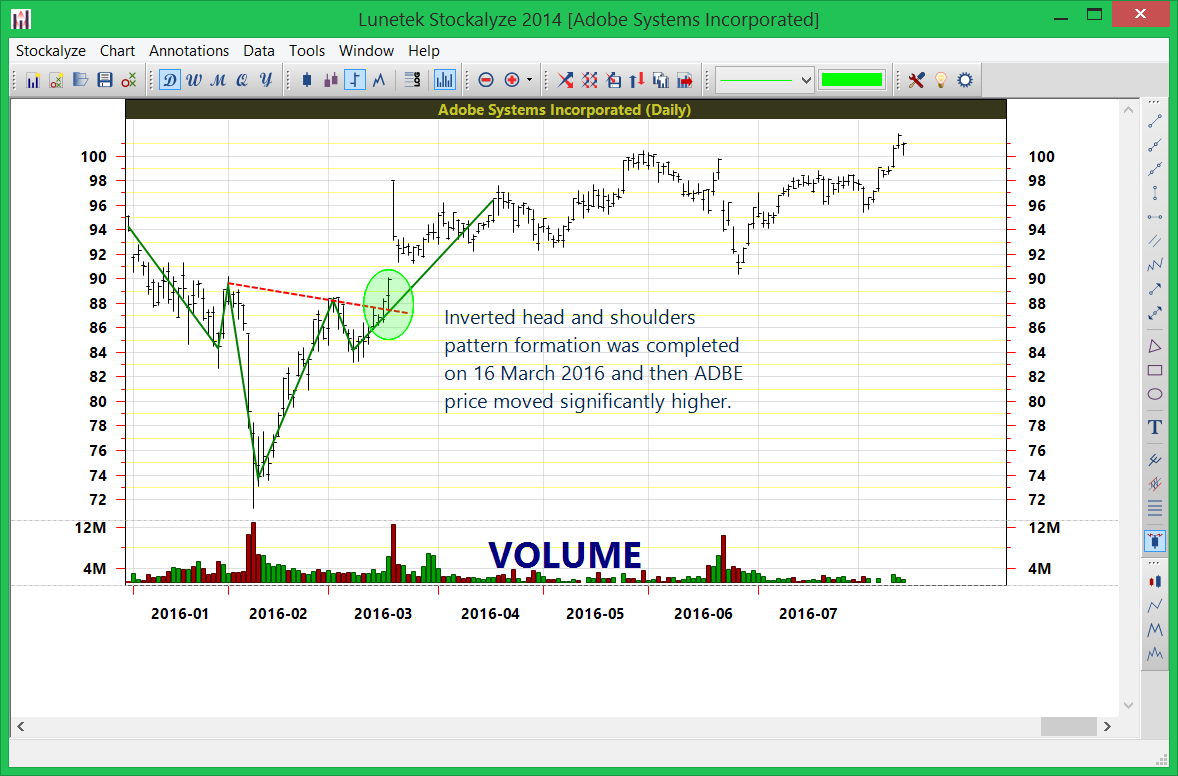
Head and Shoulders pattern on ADBE daily chart — pattern completed March 16, 2016, followed by significant price increase
How to Add Pattern Detection to Your Chart
Accessing Pattern Detection
Use one of these methods to add pattern detection:
Method 1: Chart Menu
- Go to Chart → Add Pattern Detector
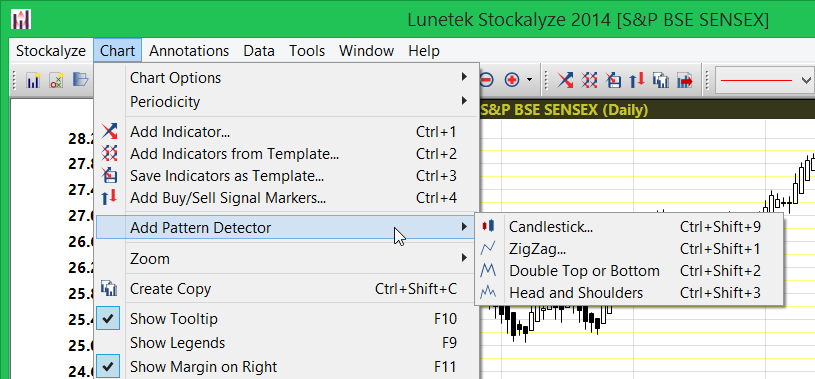
Menu item: Chart → Add Pattern Detector
Method 2: Toolbar Buttons
Click the appropriate toolbar button on the right side of the chart:
Zigzag Pattern Setup
- Select Chart → Add Pattern Detector → Zigzag
- A configuration dialog appears (details below)
- Configure the threshold percentage and colors
- Click OK
- Zigzag pattern is instantly displayed on your chart
Double Top/Bottom Detection
- Click the 'Detect double top and bottom patterns' tool button on the right side of the chart
- A configuration dialog appears
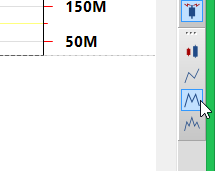
Double top detection tool button
Head and Shoulders Detection
- Click the 'Detect head and shoulders pattern' tool button on the right side of the chart
- A configuration dialog appears
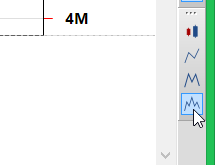
Head and shoulders pattern detection tool button
Pattern Detection Configuration
Double Top/Bottom Configuration Dialog
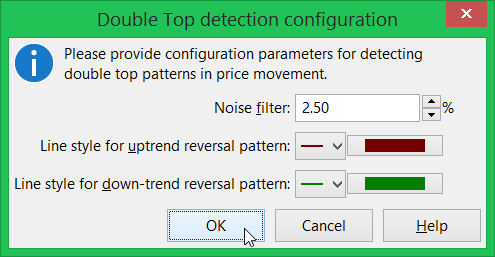
Double top/bottom pattern detection configuration dialog
Configuration Options:
- Noise Filter: Specifies the minimum price move required to identify a pattern. Lower values detect more patterns, higher values filter for more significant patterns only.
- Colors: Choose the colors used to highlight detected patterns on your chart
Head and Shoulders Configuration Dialog
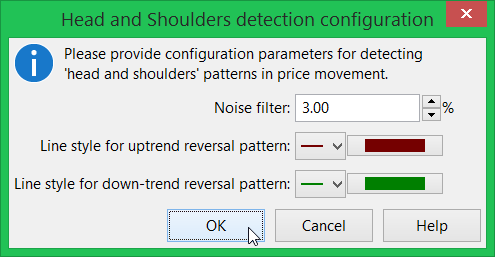
Head and Shoulders pattern detection configuration dialog
Configuration Options:
- Noise Filter: Controls sensitivity of pattern detection. Higher values require more obvious patterns.
- Colors: Customize display colors for the pattern components
Zigzag Configuration
Threshold Percentage: The most critical parameter for zigzag pattern. Examples:
- 1%: Very sensitive, will show many small zigzags. May show too much detail.
- 2.5%: Balanced setting. Good for general trend visualization. Popular default.
- 5%: Less sensitive, shows only major moves. Good for filtering significant trends.
- 10%+: Very insensitive, shows only major market moves. For major trend analysis only.
Interpreting Detected Patterns
Double Top/Bottom Pattern Interpretation
When a Double Top is Detected:
- Look for the neckline (the low between the two peaks)
- Wait for price to break below the neckline to confirm the reversal
- A potential price target is often measured from the head to neckline, then projected downward
When a Double Bottom is Detected:
- Look for the neckline (the high between the two troughs)
- Wait for price to break above the neckline to confirm the reversal
- A potential price target is measured from neckline to the head, then projected upward
Remember: Not all detected patterns will result in reversals. Always wait for confirmation (price breaking the neckline).
Head and Shoulders Pattern Interpretation
For Normal (Bearish) Head and Shoulders:
- The pattern typically completes when price breaks below the neckline
- Measure distance from head to neckline
- Project that distance downward from the neckline to estimate price target
- Watch for strong breakouts below the neckline on volume for confirmation
For Inverted (Bullish) Head and Shoulders:
- The pattern typically completes when price breaks above the neckline
- Measure distance from head to neckline
- Project that distance upward from the neckline to estimate price target
- Watch for strong breakouts above the neckline on volume for confirmation
Pattern Detection Best Practices
- Wait for Confirmation: A detected pattern is not a guarantee. Wait for price action to confirm (e.g., breaking the neckline).
- Adjust Noise Filter: Different securities and timeframes may need different noise filters.
- Combine with Other Analysis: Use pattern detection alongside technical indicators for better signals.
- Look for Confluence: Patterns detected near key support/resistance levels are more significant.
- Multi-Timeframe Confirmation: A pattern on multiple timeframes (daily, weekly, monthly) is more significant.
- Monitor Volume: Patterns that complete on high volume are more reliable than those on low volume.
- Historical Testing: Test patterns on historical charts to see how often they resulted in profitable trades.
- Risk Management: Use detected patterns as confirmation tools, not as sole trading signals. Always use proper risk management.
Advanced Pattern Analysis
Failed Patterns
Sometimes a pattern looks complete but doesn't result in the expected move. This is called a "failed pattern." Failed patterns can sometimes result in even more powerful moves in the opposite direction.
Combining Pattern Types
You can add multiple pattern detectors to the same chart to see various patterns simultaneously. For example, add both zigzag and head & shoulders detection to analyze all possible patterns.
Pattern-Indicator Confluence
Look for zones where detected patterns emerge at the same time as indicator signals. These confluence zones often produce the most powerful trades.
Related Topics
- Stock Chart Guide — Overview of all charting features
- Technical Indicators — Use indicators alongside pattern detection
- Chart Annotations — Mark key levels and patterns manually
- Creating Stock Charts — Basics of chart creation
- Signal Markers — Add trading signals to charts
 Stockalyze Help Manual