Stock Chart Timeframes and Zoom Levels
Mastering timeframes and zoom levels is essential for effective technical analysis. This guide explains all available timeframes, how to switch between them, and how to zoom in and out on your stock charts.
Understanding Chart Timeframes
A timeframe (or periodicity) determines the size of each candle on your chart. For example, a daily timeframe shows one candle per day, while a weekly timeframe shows one candle per week. Different timeframes reveal different trends and patterns.
EOD Chart Timeframes
End-Of-Day charts in Stockalyze support flexible timeframe selection. You can choose from the following options or use Auto mode:
EOD Chart timeframe toolbar
Available EOD Timeframes
| Timeframe | Description |
| Auto | Automatically selects the optimal timeframe based on your current zoom level and screen width. As you zoom out to view longer periods, the timeframe may automatically switch from daily to weekly or monthly for better visibility. |
| Daily | Shows one candle per trading day. Best for short-term traders and swing traders. |
| Weekly | Shows one candle per week. Ideal for analyzing weekly trends and support/resistance levels. |
| Monthly | Shows one candle per month. Useful for identifying long-term trends and major support/resistance. |
| Quarterly | Shows one candle per quarter (3 months). Helps identify quarterly performance patterns. |
| Yearly | Shows one candle per year. Best for analyzing long-term historical performance and decades-long trends. |
Auto Timeframe Explained
The Auto timeframe is selected by default and provides intelligent timeframe selection:
- When viewing 10+ years of data (heavily zoomed out), Auto selects weekly or monthly for optimal readability
- When viewing 1 year of data (moderate zoom), Auto selects daily timeframe
- The timeframe adjusts automatically as you zoom in and out
- This prevents charts from becoming too cluttered with too many candles
Tip: If you prefer a specific timeframe regardless of zoom level, select a fixed timeframe (Daily, Weekly, etc.) instead of Auto.
Intraday Chart Timeframes
Intraday charts display price action within trading days and support minute-level precision:
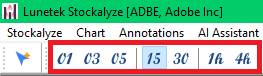
Intraday Chart timeframe toolbar
Available Intraday Timeframes
| Timeframe | Description |
| 1 Minute | Shows price movement in 1-minute intervals. Ideal for scalpers and high-frequency traders. |
| 3 Minutes | Shows price movement in 3-minute intervals. Useful for filtering out noise while maintaining detail. |
| 5 Minutes | Shows price movement in 5-minute intervals. Popular choice for day traders. |
| 15 Minutes | Shows price movement in 15-minute intervals. Default timeframe for new intraday charts. Good balance between detail and noise filtering. |
| 30 Minutes | Shows price movement in 30-minute intervals. Useful for medium-term intraday analysis. |
| 1 Hour | Shows price movement by the Hour. Suitable for swing traders and position traders. |
| 4 Hours | Shows price movement in 4-hour intervals. Useful for analyzing significant intraday trends. |
Note: The default intraday timeframe is 15 minutes. This preference is remembered for future intraday charts. For other timeframes, use the Chart → Timeframe menu.
Stock Chart Zoom Levels
Zoom controls let you adjust how much historical data is visible on your screen, helping you focus on specific time periods or see the big picture.
EOD Chart Zoom Options
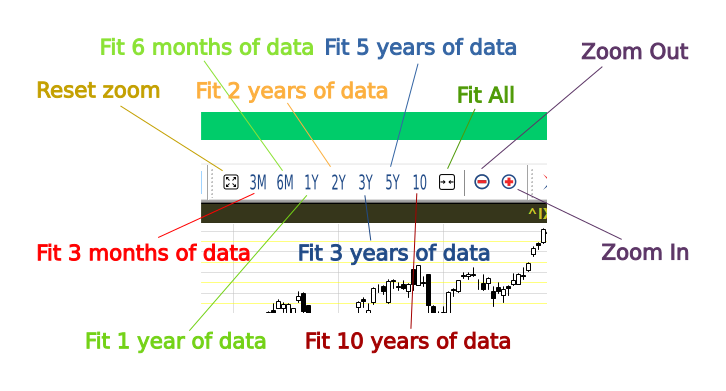
EOD chart zoom options toolbar
Available Zoom Levels for EOD Charts
| Zoom Level | Description |
| Reset | Returns to the default zoom level, typically showing 1-2 years of recent data. |
| 3M | Displays approximately 3 months of data in the visible area. Good for short-term trend analysis. |
| 6M | Displays approximately 6 months of data. Useful for medium-term trading strategies. |
| 1Y | Displays approximately 1 year of data. Popular choice for analyzing annual performance. |
| 2Y | Displays approximately 2 years of data. Good for identifying longer-term support and resistance. |
| 3Y | Displays approximately 3 years of data. Reveals multi-year trends and cycles. |
| 5Y | Displays approximately 5 years of data. Useful for long-term investors. |
| All | Displays all available historical data. Shows the complete trading history available in Stockalyze. |
| Zoom Out | Reduces zoom level incrementally, showing more historical data. |
| Zoom In | Increases zoom level incrementally, focusing on more recent data. |
Intraday Chart Zoom Options
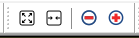
Intraday chart zoom options toolbar
Intraday charts have simpler zoom controls since the visible data range is primarily determined by the selected timeframe:
- Zoom In — Focus on more recent price action
- Zoom Out — See more historical intraday data
- Fit All Data — Display all available intraday data in the visible area
- Zoom Reset — Return to the default zoom level
Timeframe and Zoom Interaction
When using Auto timeframe, changing your zoom level may automatically switch the displayed timeframe:
- Click 1Y or more with Auto timeframe enabled, and the chart may automatically switch from daily to weekly timeframe for optimal visibility
- Click 3M with Auto timeframe enabled, and the chart may revert to daily timeframe to show more detail
- This automatic switching prevents charts from becoming overcrowded or too sparse
Tips for Effective Timeframe and Zoom Usage
- Multi-timeframe analysis: View the same stock on daily, weekly, and monthly timeframes to get a complete picture
- Confirm trends: Use longer timeframes (weekly/monthly) to confirm trends identified on daily charts
- Find entry points: Use shorter timeframes for precise entry and exit points
- Avoid false signals: Longer timeframes typically produce fewer but more reliable signals
- Screen real estate: Zoom appropriately to maximize the number of candles visible without creating clutter
Related Topics
- Stock Chart Guide — Overview of all charting features
- Creating Stock Charts — Steps to create your first chart
- Technical Indicators — Enhance your charts with indicators
 Stockalyze Help Manual