Technical Indicators
Technical indicators are mathematical calculations based on historical price and volume data. They are fundamental to technical analysis and help traders forecast price movements and identify trading opportunities. Stockalyze supports a comprehensive set of fully configurable technical indicators.
What are Technical Indicators?
Technical indicators are tools used in technical analysis to analyze securities and identify trading signals. They function by:
- Analyzing historical price and volume data
- Performing mathematical calculations on that data
- Displaying results visually on your chart
- Providing signals for potential entry and exit points
Indicators help traders identify trends, momentum, volatility, and support/resistance levels that might not be obvious from price action alone.
Why Use Technical Indicators?
Technical indicators offer several benefits for traders and investors:
- Trend Confirmation: Confirm whether a trend is strong or weakening
- Signal Generation: Generate buy and sell signals
- Momentum Assessment: Identify if a security is overbought or oversold
- Volatility Measurement: Gauge market volatility and risk
- Support and Resistance: Identify potential support and resistance levels
- Divergence Detection: Spot divergences between price and indicator
How to Add a Technical Indicator to Your Chart
Stockalyze makes it easy to add technical indicators. Here are three methods:
Method 1: Using the Chart Menu
- With a chart open, click Chart → Add Indicator...
- The Indicator Selection Dialog will open
- Browse or search for your desired indicator
- Select the indicator and click OK
Method 2: Keyboard Shortcut
- With a chart open, press Ctrl+1
- The Indicator Selection Dialog will open immediately
Method 3: Indicator Toolbar
- Click the Add Indicator button on the chart's indicator toolbar
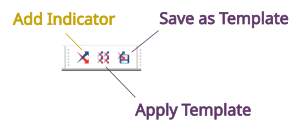
Chart Indicator Toolbar
Indicator Selection Dialog
The Indicator Selection Dialog displays all available indicators organized by category:
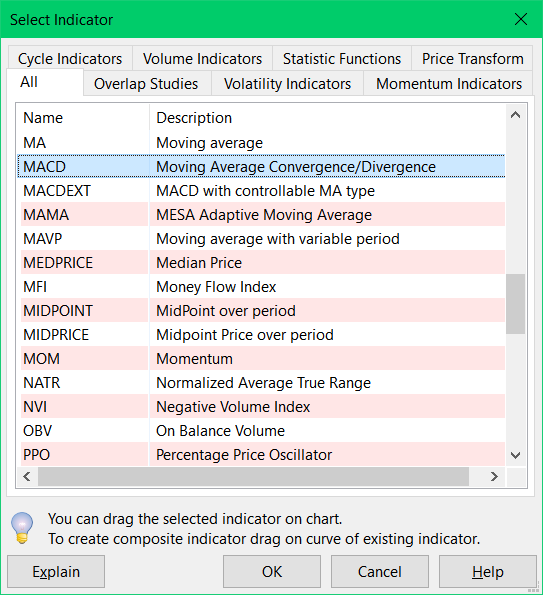
Indicator Selection Dialog showing categories and indicators
Using the Indicator Selection Dialog
- Browse by Category: Click tabs to view indicators grouped by type (Momentum, Trend, Volatility, Volume, etc.)
- Search Indicators: Use the search box to find indicators by name
- View Description: Select an indicator to see its description and parameters
- Select and Add: Click the indicator and then click OK to add it to your chart
Configuring Indicators
Once you select an indicator, the Indicator Configuration Dialog appears, allowing you to customize:
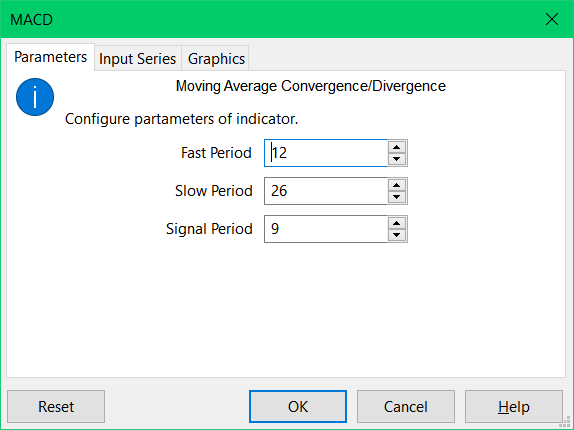
Indicator Configuration Dialog - MACD Example
Typical Configuration Options
- Period Parameters: Adjust the lookback period (e.g., 14-period RSI, 20-period moving average)
- Input Series: Choose which data to use (close price, open price, HL/2, etc.)
- Colors: Customize the display colors of the indicator
- Line Width: Adjust line thickness for visibility
- Display Options: Show/hide specific components of the indicator
Popular Technical Indicators in Stockalyze
Momentum Indicators
Momentum indicators measure the rate of price change:
- MACD (Moving Average Convergence Divergence) — Identifies trend changes and momentum shifts. Shows when a trend may be weakening.
- RSI (Relative Strength Index) — Measures overbought and oversold conditions on a 0-100 scale. Values above 70 suggest overbought; below 30 suggest oversold.
- Stochastic Oscillator — Compares closing price to range over time. Helpful for identifying potential reversals.
- CCI (Commodity Channel Index) — Identifies cyclical trends and overbought/oversold conditions.
Trend Indicators
Trend indicators help identify the direction and strength of a trend:
- Moving Averages (SMA, EMA, WMA) — Smooth price data to identify trend direction. Commonly used for crossover strategies.
- ADX (Average Directional Index) — Measures trend strength without indicating direction. Higher ADX values indicate stronger trends.
- Parabolic SAR — Provides entry and exit points. The indicator trails price and reverses when momentum shifts.
Volatility Indicators
Volatility indicators measure how much price fluctuates:
- Bollinger Bands — Shows upper and lower price bands. Helps identify overbought/oversold conditions and volatility changes.
- ATR (Average True Range) — Measures volatility magnitude. Higher ATR means higher volatility.
- Keltner Channels — Similar to Bollinger Bands but uses ATR for channel width.
Volume Indicators
Volume indicators analyze trading volume patterns:
- Volume — Bar chart showing trading volume. Higher volume often confirms price moves.
- OBV (On-Balance Volume) — Accumulates volume based on price direction. Helps confirm trends.
- MFI (Money Flow Index) — Combines price and volume to measure buying/selling pressure.
Example: Adding MACD to Your Chart
- Press Ctrl+1 or click Chart → Add Indicator...
- In the Indicator Selection Dialog, find MACD under the Momentum Indicators tab
- Click OK — the configuration dialog appears
- The default MACD settings are typically good for most traders; click OK again
- MACD will be added to your chart below the price action
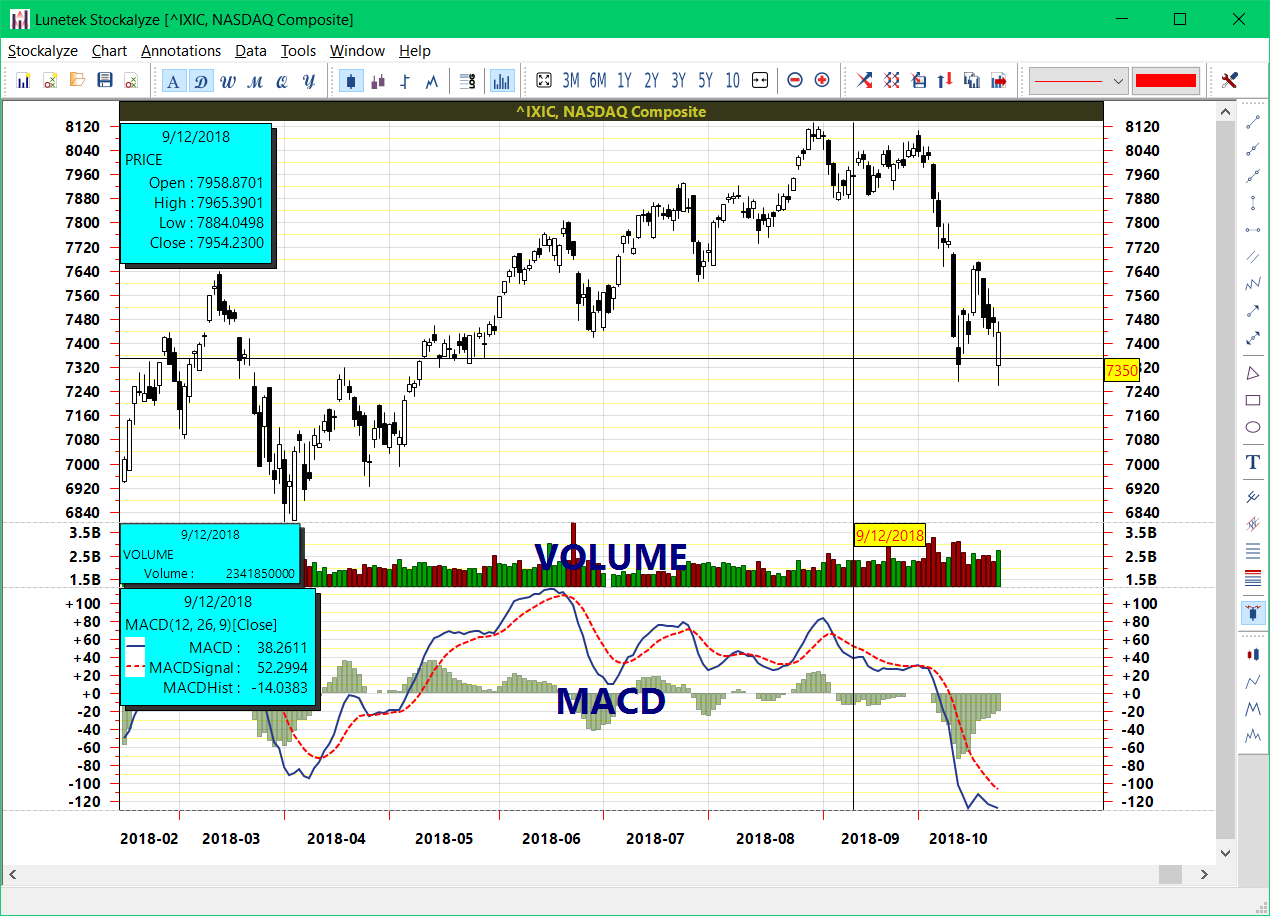
NASDAQ chart with MACD indicator
Multi-Indicator Strategies
Powerful analysis comes from combining multiple indicators:
- Trend + Momentum: Use a moving average for trend direction and RSI for entry timing
- Volatility + Breakout: Use Bollinger Bands with volume to confirm breakouts
- Divergence Detection: Compare price movement with momentum indicators to spot divergences
You can add as many indicators as needed to your chart. For frequently used combinations, consider creating Indicator Templates.
Advanced: Composite Indicators
Stockalyze allows you to create indicators based on other indicators. For example, you could apply Bollinger Bands to an RSI indicator. See Composite Indicators for detailed instructions.
Indicator Best Practices
- Don't Overuse: Too many indicators can create conflicting signals. Start with 2-3 reliable indicators.
- Understand Your Indicators: Know what each indicator measures and its limitations.
- Combine with Price Action: Use indicators to confirm price action, not replace it.
- Test on Historical Data: Backtest your indicator strategies on historical charts before trading.
- Adjust for Your Timeframe: Indicator parameters may need adjustment for different timeframes.
- Use Templates: Save your preferred indicator setups as templates for consistency.
Related Topics
- Stock Chart Guide — Overview of all charting features
- Composite Indicators — Create indicator-of-indicator analyses
- Indicator Templates — Save and reuse indicator configurations
- Indicator Selection Dialog — Detailed help on the indicator dialog
- Signal Markers — Add buy/sell signals to charts
 Stockalyze Help Manual