Trend Visualization
Trend Visualization is a powerful technical analysis tool that helps you quickly identify and visualize trends in price movements or any indicator. Instead of manually tracing trend lines, Stockalyze can automatically detect uptrends, downtrends, and neutral periods using precise mathematical definitions. This guide explains how to use Trend Visualization to enhance your technical analysis.
What is Trend Visualization?
Trend Visualization automatically identifies and highlights trends in your selected data series (price or indicator) by drawing colored trend lines on your chart. The key features include:
- Automatic Trend Detection: Identifies uptrends, downtrends, and neutral movements without manual intervention
- Strict Trend Definitions: Uses precise technical definitions based on higher-high-higher-low and lower-low-lower-high rules
- Noise Filtering: Apply a customizable filter to reduce market noise and focus on significant trends
- Flexible Data Sources: Works with price data (open, high, low, close) and any technical indicator on your chart
- Customizable Styling: Change colors and line styles for uptrends, downtrends, and neutral trends to match your preferences
- Real-Time Updates: Trends update dynamically as you adjust configuration parameters
Understanding Trend Definitions
Stockalyze uses strict, mathematically precise definitions for identifying trends. This ensures consistent and reliable trend detection:
Uptrend
An uptrend is identified when the price or indicator creates a series of progressively higher peaks (highs) and higher troughs (lows). In technical analysis, this is described as "Higher High, Higher Low" pattern.
- Each successive high point must be higher than the previous high point
- Each successive low point must be higher than the previous low point
- This pattern continues until the rule is broken (violation of either condition)
Downtrend
A downtrend is identified when the price or indicator creates a series of progressively lower peaks (highs) and lower troughs (lows). In technical analysis, this is described as "Lower High, Lower Low" pattern.
- Each successive high point must be lower than the previous high point
- Each successive low point must be lower than the previous low point
- This pattern continues until the rule is broken (violation of either condition)
Neutral Trend
A neutral trend occurs when the data does not conform to either the uptrend or downtrend definitions. This typically represents periods of consolidation, ranging markets, or indecision where neither buyers nor sellers have clear control.
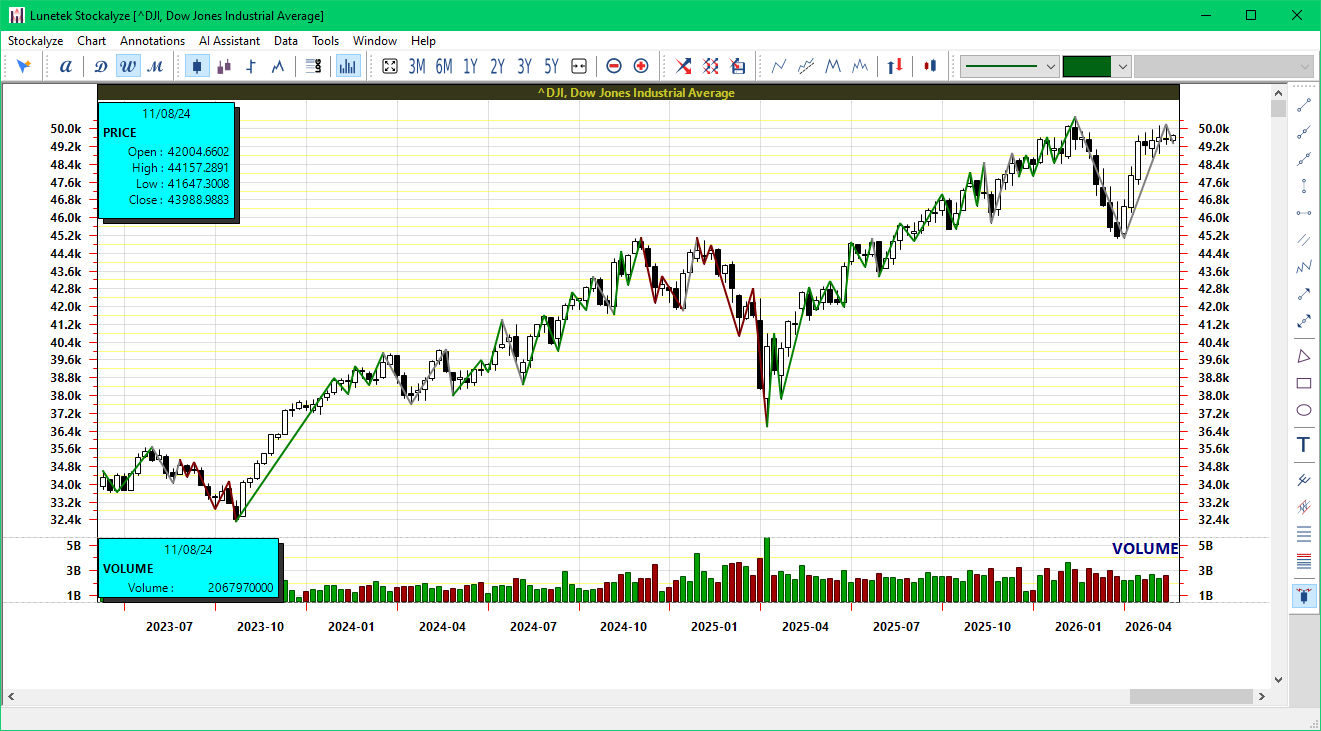
Trend Visualization showing uptrend (green), downtrend (red), and neutral (gray) trends with their respective colored lines
How to Add Trend Visualization
Step 1: Open or Create a Stock Chart
First, open a technical stock chart in Stockalyze. If you don't have a chart open yet, create one by selecting a stock symbol and choosing your preferred timeframe.
Step 2: Access Trend Visualization Tool
To add Trend Visualization to your chart, go to Chart → Add Pattern Detector → Visualize Trends from the menu bar.
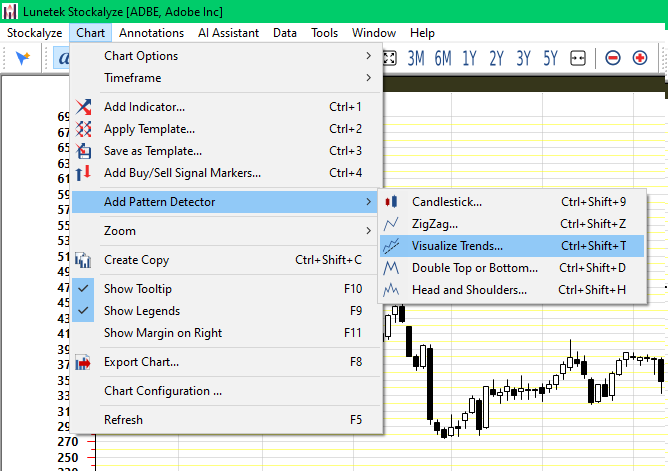
Accessing Trend Visualizer from the Chart menu
Alternatively, you can use the Trend Visualization tool from the toolbar.
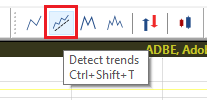
Accessing Trend Visualizer from the toolbar
Or, you can also hit the keyboard shortcut Ctrl + Shift + T for Trend Visualization.
Step 3: Configure Trend Visualization
The Trend Configuration dialog will open. Here you can customize all aspects of the trend visualization:
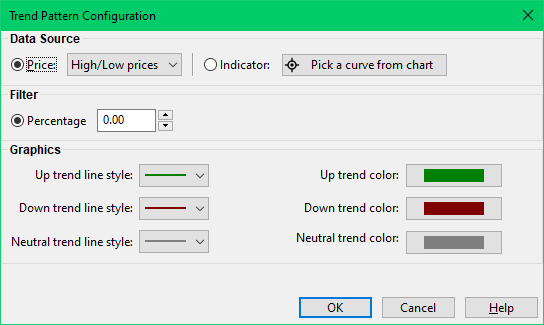
Trend Visualization Configuration dialog with all available options
Configuration Options
Data Source Selection
Choose which data series to analyze for trends:
- Price Data: You can select from standard price series:
- Open
- High
- Low
- Close (most commonly used)
- Indicator Data: Any technical indicator displayed on your chart can be analyzed for
trends. To select an indicator:
- Click the "Pick a curve from Chart" button
- Click directly on the indicator line you want to analyze
- The indicator will be automatically selected and its name will appear in the dialog
Clicking on an indicator to select it for trend analysis (useful when chart has multiple indicators)
Noise Filter
The noise filter reduces the impact of minor price fluctuations and helps focus on significant trend moves. The filter value represents a percentage threshold:
- Zero Filter (0%): No filtering; every price movement is considered
- Small Filter (1-3%): Minimal filtering; useful for sensitive trend detection
- Medium Filter (3-7%): Moderate filtering; balances sensitivity with noise reduction (commonly used)
- Large Filter (7%+): Strong filtering; focuses only on major trend moves
As you adjust the filter value, the chart updates in real-time, allowing you to see the effect immediately.
Below are some examples of trend visualization with different noise filter values. In these images the display of price data is not shown to keep the focus on the trend lines.
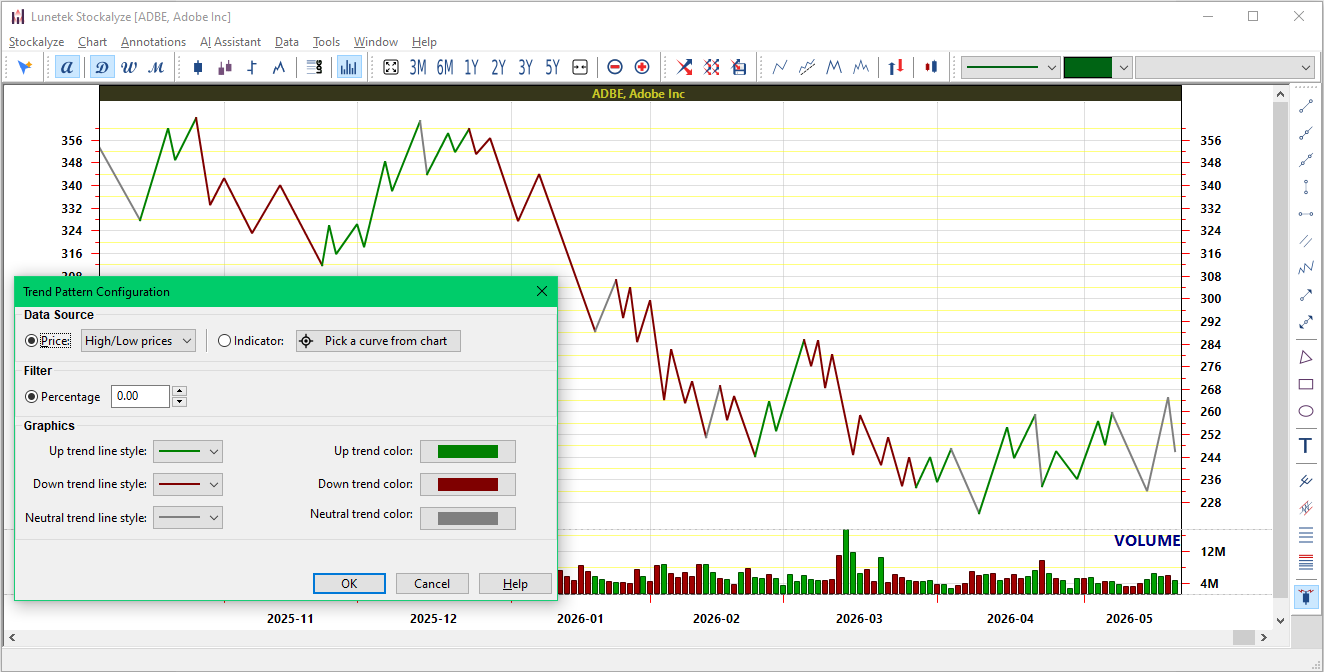
Trend visualization for ADBE without noise filter, i.e., 0% filter
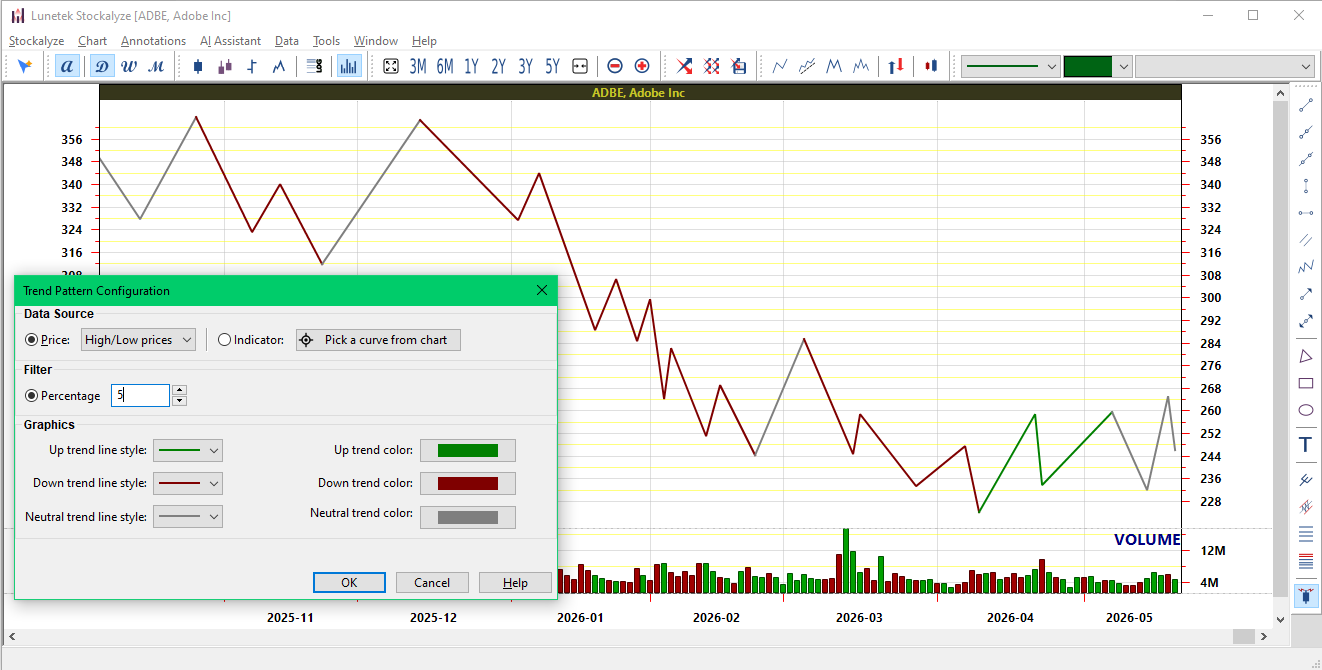
Trend visualization for ADBE with 5% noise filter, showing smoother trends
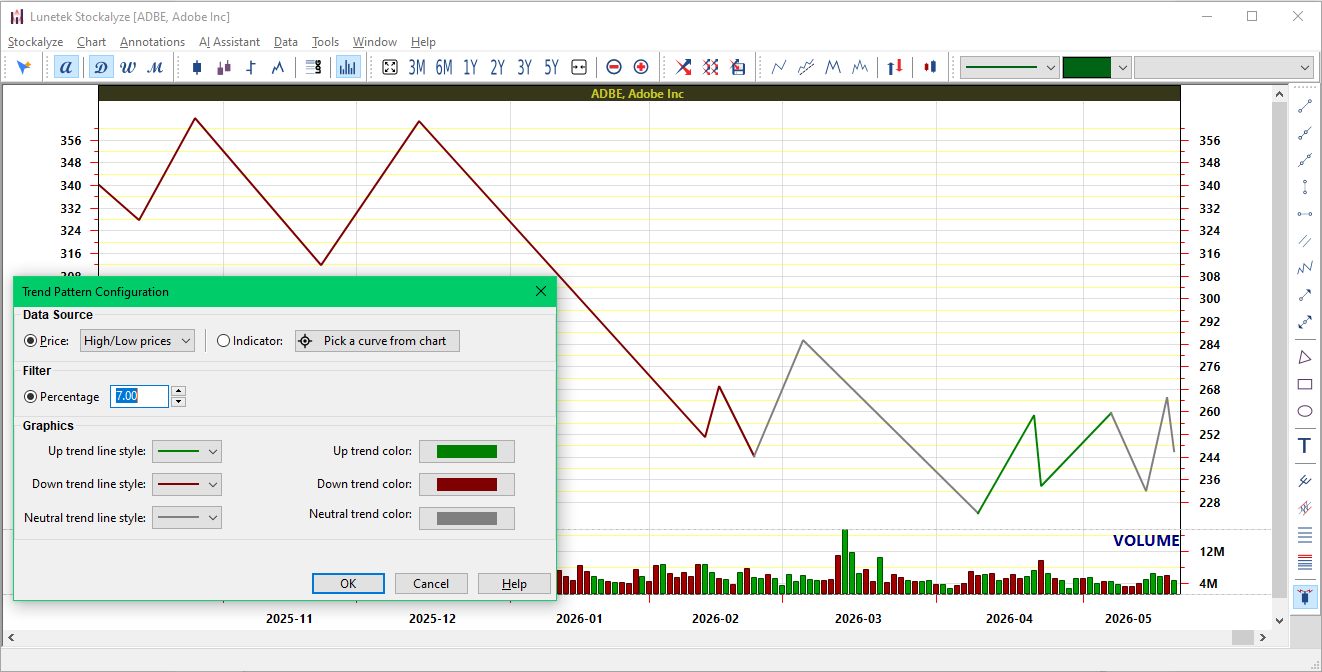
Trend visualization for ADBE with 7% noise filter, focusing on major trend moves
Styling: Colors and Line Styles
Customize the appearance of each trend type to match your preferences:
Uptrend Styling
- Color: Click the color picker to choose the uptrend line color (default: green)
- Line Style: Select from various line patterns (solid, dashed, dotted, etc.)
- Line Width: Set the thickness of the uptrend line
Downtrend Styling
- Color: Click the color picker to choose the downtrend line color (default: red)
- Line Style: Select from various line patterns
- Line Width: Set the thickness of the downtrend line
Neutral Styling
- Color: Click the color picker to choose the neutral trend line color (default: gray)
- Line Style: Select from various line patterns
- Line Width: Set the thickness of the neutral trend line
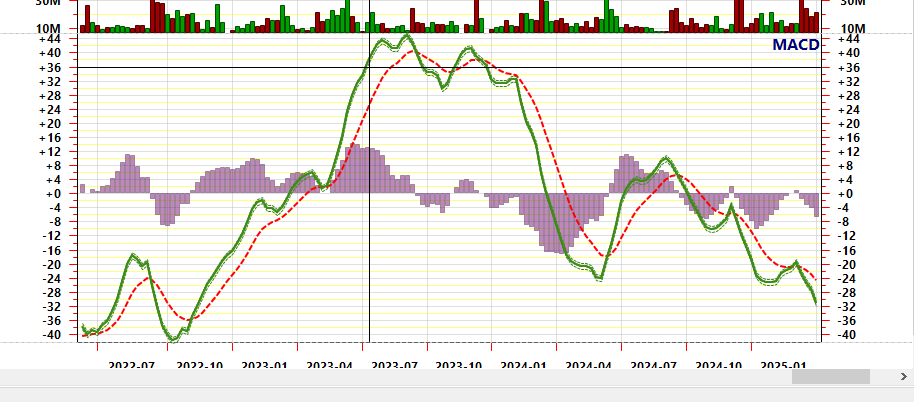
Visualizing Indicator Trends
One of the most powerful features of Trend Visualization is the ability to analyze trends in technical indicators, not just price movements. Just click the "Pick a curve from Chart" button and select an indicator to visualize its trends.
Use Cases for Indicator Trend Visualization:
- Moving Averages: Visualize trends in moving averages to confirm price trends
- MACD: Identify trend changes in MACD line or signal line
- RSI: Detect trends in the RSI indicator to identify momentum shifts
- ADX: Analyze ADX trends to measure trend strength
- Custom Indicators: Apply trend visualization to any custom indicator you've created
Real-Time Updates
As you adjust any configuration parameter (data source, noise filter, colors, line styles), the chart updates in real-time. This allows you to:
- Experiment with different filter values to find the optimal level for your analysis style
- Instantly see how different line colors and styles appear on your specific chart
- Compare trends across different data sources by switching between price and indicators
- Make adjustments without closing and reopening the configuration dialog
Related Features: Zigzag Patterns
Stockalyze also offers Zigzag Pattern detection, which is closely related to Trend Visualization:
- Zigzag Pattern: Focuses on identifying and connecting significant price swings by filtering noise
- Trend Visualization: Identifies and labels the trend direction (up/down/neutral) of those price swings
- Both tools can be used together on the same chart for comprehensive trend analysis
Practical Tips and Examples
Tip 1: Finding the Right Filter Level
The optimal filter value depends on your trading timeframe and style:
- Intraday Trading: Use lower filter values (1-3%) for more sensitive trend detection
- Swing Trading: Use medium filter values (3-7%) to ignore minor fluctuations
- Long-term Investing: Use higher filter values (7%+) to focus on major trend moves
Tip 2: Confirming Trends with Multiple Indicators
Apply Trend Visualization to multiple indicators to confirm trend signals:
- If price shows an uptrend and MACD also shows an uptrend, the signal is stronger
- If price is in uptrend but RSI is in downtrend, there might be divergence (potential reversal signal)
- Use trend confirmations to increase confidence in your trading decisions
Tip 3: Identifying Trend Reversals
Watch for color changes in the trend visualization to spot potential reversals. In the below example we see that the trend visualization shows frequent color change lately as of 20 May 2026 on daily chart of ADBE, signaling a potential trend reversal.
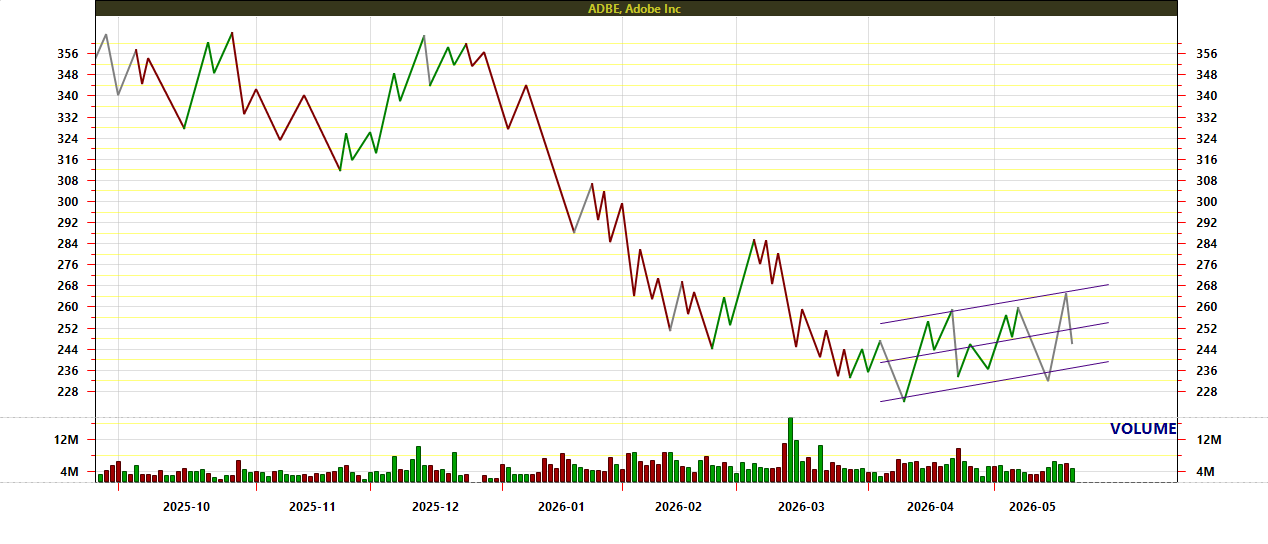
ADBE on daily chart shows a possible future trend reversal
It is important to note that trend reversals are not always guaranteed and should be confirmed with other technical analysis tools. Also, consider the trend reversal on different timeframes. For example, a trend reversal on a daily chart might not be confirmed on a weekly chart. If it is confirmed, it can provide a strong signal for potential trend changes.
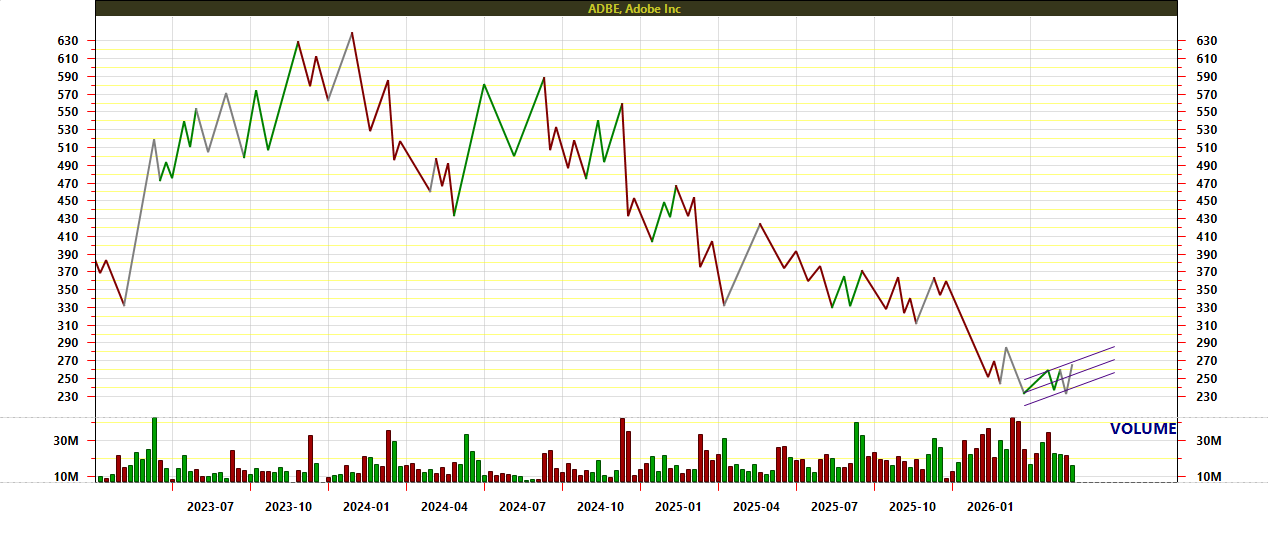
ADBE on weekly chart shows a possible future trend reversal
Tip 4: Combining with Other Annotations
Trend Visualization works well alongside other chart annotations:
- Use manual trend lines for longer-term trend analysis
- Add Signal Markers based on trading systems to identify entry/exit points
- Combine with technical indicators for comprehensive analysis
- Use text annotations to mark important trend change points
Saving and Reusing Configurations
Once you've configured a Trend Visualization that you like, your settings are automatically saved for that chart. The next time you open the same chart, your Trend Visualization will be there with the same configuration.
You can also create multiple Trend Visualizations on the same chart if you want to analyze different data sources (for example, one for price and one for a specific indicator).
Troubleshooting
Trend lines are not showing up
- Make sure you've selected a valid data source (price or indicator)
- Check that your chart has enough data points for trend analysis
- Try adjusting the noise filter value
Trends are changing too frequently
- Increase the noise filter value to smooth out minor fluctuations
- This is particularly useful if you're analyzing intraday data
Trends are not changing at all
- Try decreasing the noise filter value
- Make sure you've selected the correct data source
- Check if the selected data series has sufficient variation
Related Topics
- Creating Stock Charts - Learn how to create and configure technical charts
- Technical Indicators - Explore available indicators to use with Trend Visualization
- Chart Pattern Detection - Related pattern detection tools
- Chart Annotations - Add manual trend lines and other annotations
- Signal Marker - Add trading system signals to your chart
 Stockalyze Help Manual