Point and Figure Charts
Point and Figure (P&F) charts are a unique charting method that strips away time and focuses purely on price action. They are especially useful for identifying support and resistance levels, trend changes, and for filtering out minor price noise in trending markets.
What are Point and Figure Charts?
Point and Figure charts are a graphical technique used to plot price movements without regard to time. Instead of plotting every price tick over a fixed time period, P&F charts:
- Use a fixed box size to represent price movements
- Plot X marks when prices rise (bullish columns)
- Plot O marks when prices fall (bearish columns)
- Only record a new column when the price reverses by a specified reversal amount
- Ignore minor price fluctuations and time passage
Why Use Point and Figure Charts?
P&F charts offer several distinct advantages:
- Cleaner Trends: Automatically filters out minor price noise and insignificant moves
- Support and Resistance: Naturally highlights psychological price levels and round numbers where traders place orders
- Pattern Recognition: Makes classic chart patterns (double tops, double bottoms, breakouts) more obvious
- Trend Clarity: Vertical columns make it easy to see the strength and direction of trends
- Entry and Exit Signals: Column reversals provide clear breakout signals
Understanding Point and Figure Basics
Boxes and Price Tiers
Stockalyze uses a tiered box sizing approach that automatically adjusts the box size based on the price level. This approach ensures that:
- Box sizes remain proportional at all price levels
- Psychological price levels (100, 200, 500, 1000, etc.) are preserved
- Support and resistance areas align naturally with market structure
The following table shows the price tiers and their corresponding box size multipliers:
| Price Range | Box Size Multiplier | Example (with 0.25 base) |
|---|---|---|
| 0 – 5 | 1× | Box size = 0.25 |
| 5 – 20 | 2× | Box size = 0.50 |
| 20 – 100 | 4× | Box size = 1.00 |
| 100 – 200 | 8× | Box size = 2.00 |
| 200 – 500 | 20× | Box size = 5.00 |
| 500 – 2,500 | 40× | Box size = 10.00 |
| 2,500 – 12,500 | 200× | Box size = 50.00 |
| 12,500 – 62,500 | 1,000× | Box size = 250.00 |
| 62,500 – 312,500 | 5,000× | Box size = 1,250.00 |
| 312,500+ | 10,000× | Box size = 2,500.00 |
X and O Marks Explained
On a P&F chart, X marks (displayed in green) represent an up column where prices are rising. O marks (displayed in red) represent a down column where prices are falling.
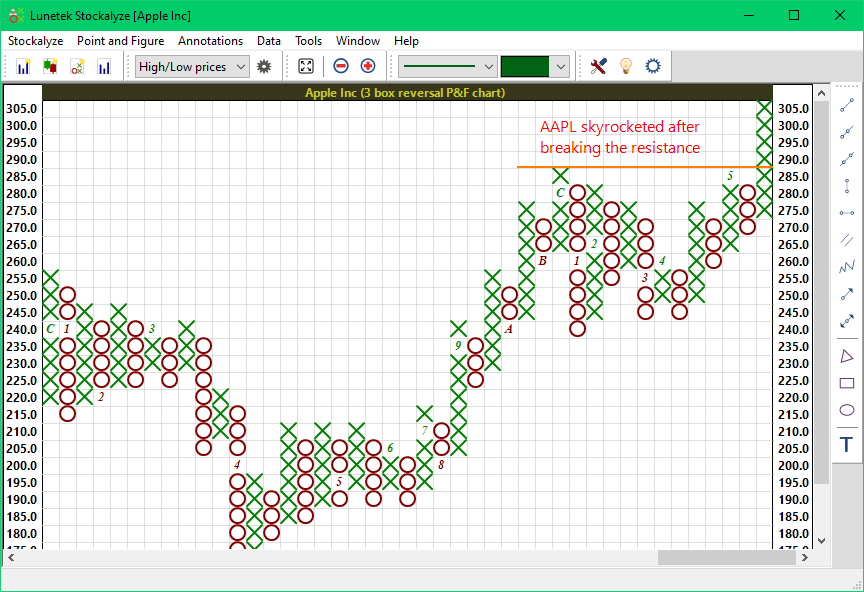
Basic Point and Figure Chart showing rising column (X marks) and falling column (O marks)
Creating a Point and Figure Chart
Step 1: Open the P&F Chart View
From the Stockalyze menu, select New EoD P&F Chart or click on the New Point and Figure Chart tool on the main Stockalyze window, also known as gateway window.
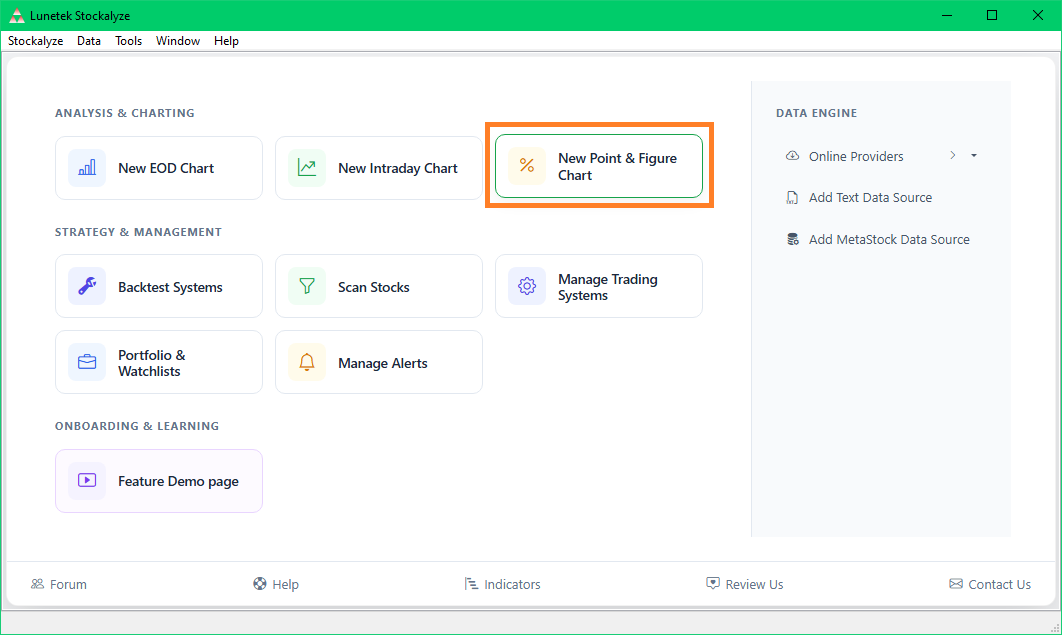
Creating a Point and Figure Chart from the gateway window
Step 2: Configure Parameters (Optional)
From the toolbar you can select if closing price should be used, or if you want to use the high/low price. You can also change other settings such as the minimum box size and reversal amount. The minimum box size is the base unit used for the lowest price tier (0–5). The reversal amount determines how many boxes of price movement are required to switch from an up column (X) to a down column (O), or vice versa. To change these settings, click on the gear icon in the toolbar.
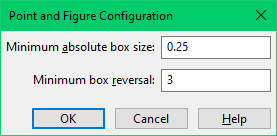
Point and Figure Configuration Dialog
Configuration Parameters
Minimum Absolute Box Size
This parameter defines the base unit box size used for the lowest price tier (prices below 5). The box size for higher price tiers is automatically calculated using the multiplier system described above.
- Default: 0.25
- Typical values: 0.10, 0.25, 0.50, 1.00
- Effect: Larger values create fewer boxes and a cleaner chart; smaller values create more detail
Example: If you set the minimum absolute box size to 0.25:
- For a 12 stock: box size = 0.25 × 2 = 0.50
- For a 150 stock: box size = 0.25 × 4 = 1.00
- For a 300 stock: box size = 0.25 × 20 = 5.00
Minimum Box Reversal
This parameter defines how many boxes of reversal are required before the chart switches from an up column (X) to a down column (O), or vice versa. It prevents the chart from constantly switching directions due to minor price fluctuations.
- Default: 3 boxes
- Typical values: 2, 3, 4, 5
- Effect: Higher values create fewer columns and a cleaner chart; lower values create more detail and more reversals
Example: With a box size of 1.00 and a 3-box reversal:
- Prices must fall 3 × 1.00 = 3.00 before switching from up (X) to down (O)
- Prices must rise 3.00 before switching back from down (O) to up (X)
Set as Default
All changes in the configuration are saved as the default for all new Point and Figure charts you create in the future.
Examples: Point and Figure Charts at Different Price Levels
Example 1: Low-Priced Stock (price below 20)
For a stock trading below 20 with 3-box reversal:
Below is point and figure chart for TomTom. Its a low-priced stock showing frequent reversals. The chart clearly shows that the stock has a long term support and resistance around 5.5.
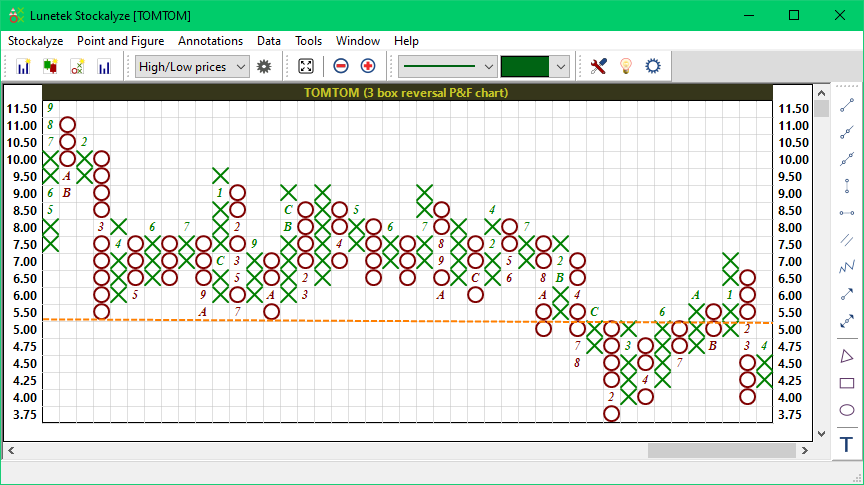
Point and Figure chart for a low-priced stock showing frequent reversals and more detail
Example 2: High-Priced Stock
Below is the point and figure chart for Microsoft (MSFT), a high-priced stock. The chart shows that the stock has a resistance level around 435. The stock has been in a long term down trend and in the short term it is an uptrend facing a resistance at 435.
Notice that the box size is larger than the low-priced stock.
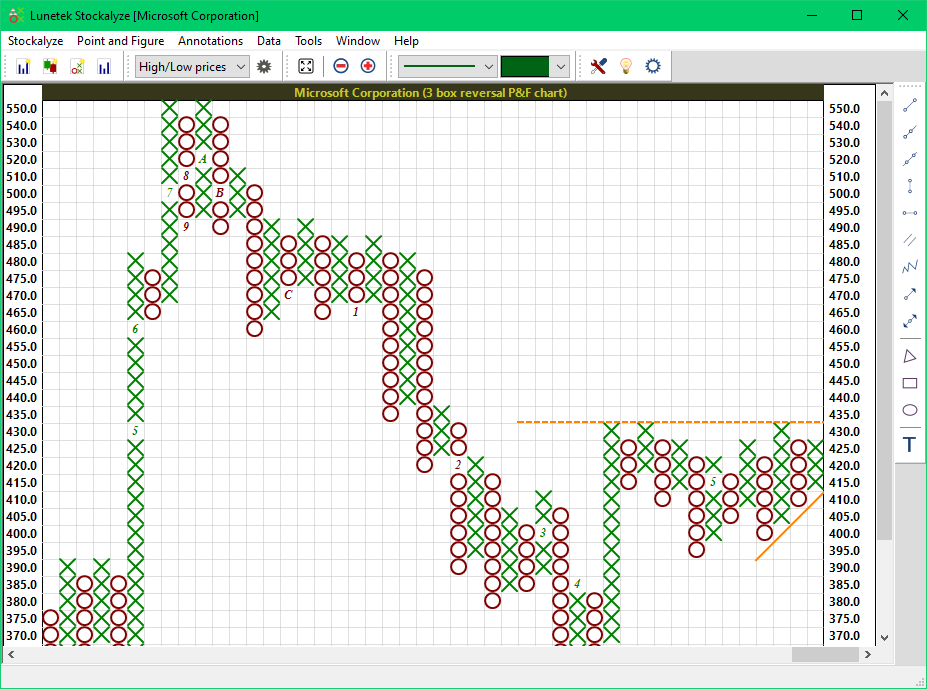
Point and Figure chart for MSFT, a high-priced stock
Reading Point and Figure Charts
Identifying Trends
On a P&F chart, a series of rising X columns indicates an uptrend, while a series of falling O columns indicates a downtrend.
Support and Resistance Levels
P&F charts naturally highlight support and resistance levels. The tiered box sizing ensures that psychological price levels (like 100, 200, 500) and price areas where the stock has repeatedly bounced are clearly visible.
Breakouts and Reversals
A column reversal—when the chart switches from X to O or vice versa—indicates a potential trend change. A breakout occurs when the price moves above or below previous X and O column extremes, signaling potential new trend.
Tips and Best Practices
Choosing the Right Box Size
- For very volatile stocks: Consider using a larger box size to filter out noise and see the main trend more clearly
- For quiet stocks: A smaller box size may provide more trading detail
- For long-term analysis: Larger box sizes work better to identify major support/resistance levels
- For short-term trading: Smaller box sizes may reveal more trading opportunities
Choosing the Right Reversal Amount
- 3-box reversal (default): Good balance between filtering noise and capturing real reversals. Recommended for most traders
- 2-box reversal: More sensitive; creates more columns and trading signals. Useful for active traders
- 4-box reversal or more: Less sensitive; requires more pronounced reversals. Better for identifying major trend changes
Combining P&F Charts with Other Tools
- Use P&F charts to identify key support and resistance levels, then confirm with technical indicators like RSI or MACD
- Look for divergences between P&F signals and price momentum indicators
- Use multiple time frames or different box sizes to confirm breakouts
- Combine P&F analysis with candlestick or bar chart analysis for confirmation
Practical Trading Approach
- Identify the trend: Look for consistent X or O columns
- Find support/resistance: Note where columns repeatedly reverse
- Watch for breakouts: When the chart moves above/below previous extremes
- Confirm with other indicators: Use volume, momentum indicators, or moving averages to confirm signals
Advanced: Using P&F Charts with Indicators
You can also create P&F charts from technical indicator output. This is useful for analyzing the behavior of indicators at different scales. For example, you might create a P&F chart from a MACD histogram to identify when momentum is reversing.
Common Questions
Why do different price levels have different box sizes?
The tiered approach ensures that a 0.25 move in a 5 stock has the same visual significance as a proportional move in a 500 stock. This makes it easy to compare chart patterns and support/resistance behavior across different price levels.
How is this different from traditional Point and Figure?
Traditional P&F charting often uses fixed box sizes (e.g., 1 for all stocks), which creates problems at very low and very high price levels. Stockalyze's tiered approach automatically adapts while preserving psychological price levels, providing cleaner and more meaningful charts.
Can I adjust the tiers?
Currently, the price tiers are fixed in Stockalyze. However, you can experiment with different base box sizes (0.10, 0.25, 0.50, 1.00) and reversal amounts to achieve different levels of detail and sensitivity.
What is the ideal reversal setting?
There is no universal "ideal" setting—it depends on your trading style and the specific security you're analyzing. A 3-box reversal is a good starting point recommended by most P&F practitioners. Experiment with 2- and 4-box reversals to see what works best for you.
Further Reading
- For more on chart types, see Stock Charts
- For candlestick charts, see Candlestick Patterns
- For technical analysis tools, see Technical Indicators
 Stockalyze Help Manual