AI Stock Chart Analysis - Help Guide
The AI Stock Chart Analyst Assistant in Stockalyze helps you generate ready-to-use prompts for AI tools like ChatGPT, Gemini, Claude, and any other AI tool. It allows you to quickly convert your chart data into structured, professional technical analysis.
How It Works
- Click the AI Analyst Assistant button in the stock chart window of Stockalyze.
- A dialog opens with a pre-generated analysis prompt.
- Click Copy Prompt or open directly in ChatGPT, Gemini, or Claude.
- Paste the prompt into the AI tool to get instant insights.
Dialog Overview
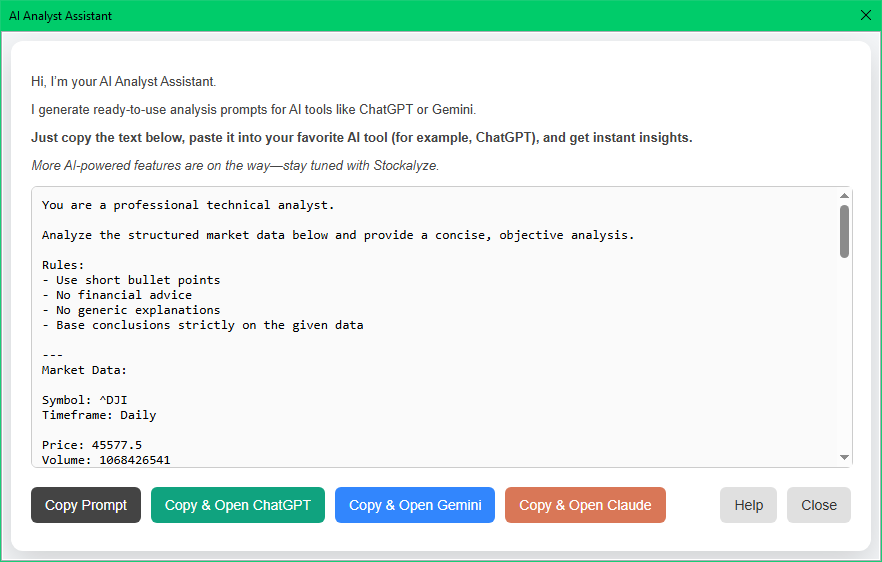
AI Analyst Assistant dialog in Stockalyze
Buttons Explained
- Copy Prompt: Copies the generated prompt.
- Copy & Open ChatGPT: Opens ChatGPT with the prompt ready.
- Copy & Open Gemini: Opens Google Gemini.
- Copy & Open Claude: Opens Claude AI.
- Help: Opens this help page.
- Close: Closes the dialog.
Example AI Prompt
Below is an example of a generated prompt for ADBE. You can paste this into any AI tool to get a structured technical analysis.
Stockalyze allows you to copy the generated prompt and use it with any AI tool. Below is an example of the analysis produced by ChatGPT using the sample prompt shown above.
1. Trend Assessment
- Strong bearish alignment across all timeframes (price below SMA20/50/200; 20 < 50 < 200)
- Price decline steep (-1.62% per period) vs flatter MA slopes → accelerated downside vs lagging averages
- Rising volume during decline → confirms trend participation and strength
- RSI at 35.95 with downward slope → sustained bearish momentum, not yet oversold
- MACD below signal → bearish bias intact
- MACD histogram negative but momentum weakening → downside pressure still present but losing intensity
- Full bearish confluence: price position, MA structure, RSI, and MACD all aligned downward
- Minor divergence: weakening MACD momentum vs still-declining price and RSI → early sign of deceleration
- %B at 0.218 → price in lower half of range but not stretched
- Band width stable → controlled, non-expanding volatility
- Positioning suggests orderly downtrend rather than panic selling
- Weakening MACD momentum → risk of short-term consolidation or bounce
- RSI not oversold → room for further downside continuation
- Increasing volume on declines → continuation risk remains elevated
- A well-established downtrend with strong bearish structure and confirmed by rising volume.
- Momentum remains negative but is starting to weaken, suggesting potential slowing rather than immediate reversal.
Analysis is not limited to the daily timeframe. You can also generate insights for other timeframes, such as weekly, enabling both short-term and long-term perspectives.
Why Use AI Analyst Assistant?
- Save time on manual analysis
- Get structured, professional insights instantly
- Works with free AI tools like ChatGPT and Gemini
- No coding or setup required
Why Use Stockalyze?
Stockalyze makes it easy to combine technical analysis with modern AI tools like ChatGPT, Gemini, and Claude. Instead of manually interpreting charts, you can generate structured prompts and get fast, data-driven insights in seconds.
Whether you're exploring AI-powered stock analysis for the first time or looking for a more efficient workflow, Stockalyze provides a practical and accessible solution. It works seamlessly with free AI tools, helping traders and investors analyze market data without expensive software or complex setups.
 Stockalyze Help Manual