Composite Indicators
Composite indicators, also known as "indicator of indicator," combine two or more indicators to create advanced analytical tools. For example, you can apply Bollinger Bands to RSI output, or apply a moving average to MACD. This guide shows you two methods for creating composite indicators.
What are Composite Indicators?
A composite indicator uses the output of one indicator as the input for another indicator. This creates more sophisticated analysis:
- Base Indicator: The first indicator that processes raw price/volume data
- Applied Indicator: The second indicator that processes the output of the base indicator
- Result: A filtered, more refined signal that may reduce noise or enhance analysis
For example:
- Bollinger Bands (applied) on RSI (base) creates volatility bands around the momentum indicator
- Moving average (applied) on MACD histogram (base) smooths the histogram signal
- Stochastic (applied) on RSI (base) identifies overbought/oversold conditions of momentum
Benefits of Composite Indicators
- Signal Refinement: Reduce false signals by applying filters to existing indicators
- Enhanced Analysis: Combine indicator strengths to create more powerful tools
- Noise Reduction: Smooth erratic indicator outputs with moving averages
- Multi-Level Analysis: Analyze trends, momentum, and volatility in layered fashion
- Custom Strategies: Build unique indicators tailored to your trading style
Method 1: Creating Composite Indicators by Drag-and-Drop
The drag-and-drop method is the simplest and most intuitive way to create composite indicators on charts.
Watch this video to learn the drag-and-drop method for creating composite indicators:
Step-by-Step: Drag-and-Drop Method
Step 1: Set Up the Base Indicator
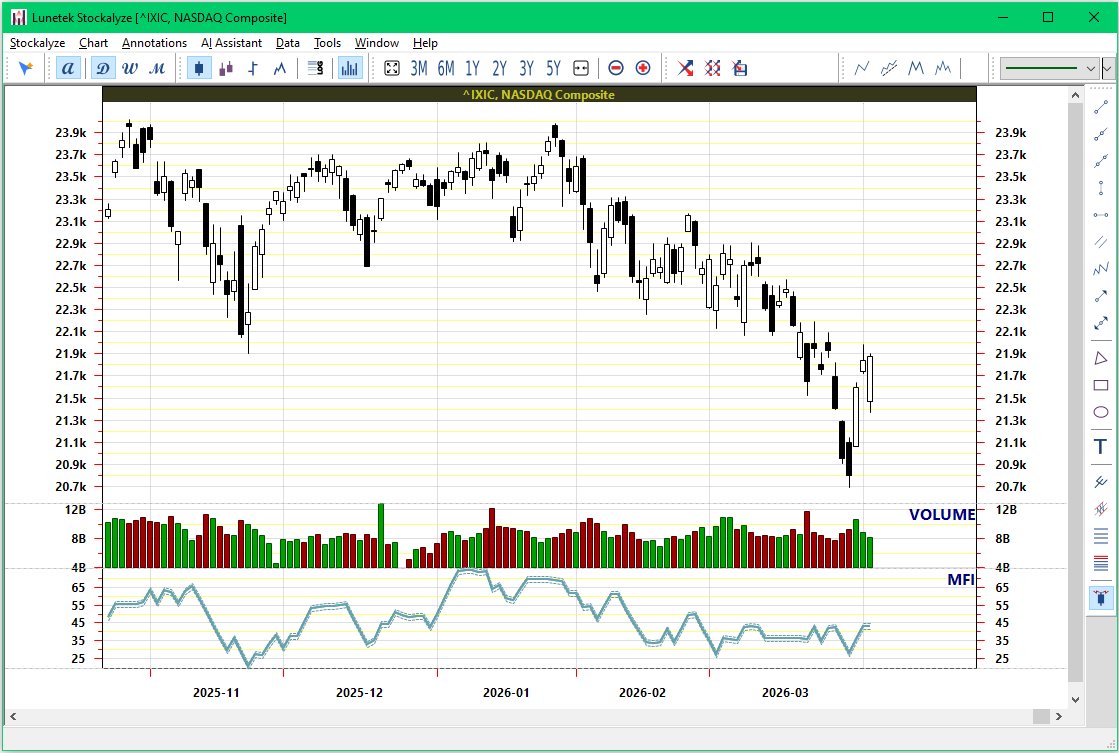
- Create a chart with your base indicator already added
- For this example, we'll create a chart with MFI (Money Flow Index)
- Press Ctrl+1 or go to Chart → Add Indicator...
- Select and add MFI to your chart
Step 2: Open the Indicator Selection Dialog
- Press Ctrl+1 or go to Chart → Add Indicator... again
- The Indicator Selection Dialog opens
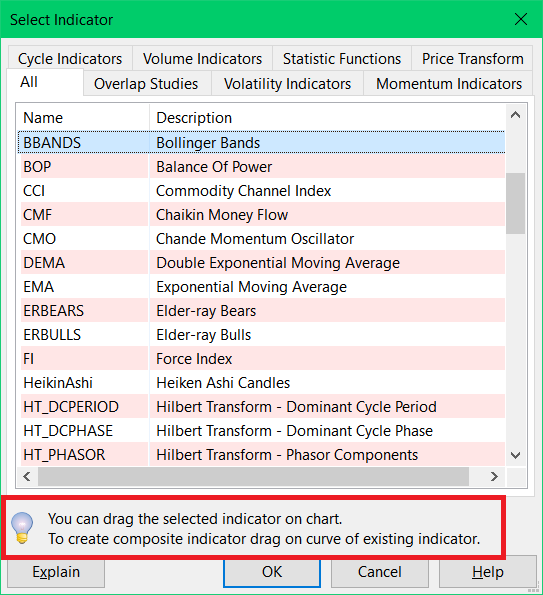
Indicator selection dialog showing the drag-and-drop tip at the bottom
Step 3: Drag the Applied Indicator
- In the Indicator Selection Dialog, find and locate your applied indicator (e.g., BBANDS - Bollinger Bands)
- Click and hold on BBANDS, then drag it from the dialog
- As you drag, the dialog will fade and your cursor will change to indicate drag mode
Step 4: Hover Over the Target Indicator
- While dragging, move your cursor over MFI indicator curve on the chart
- The MFI curve will highlight to indicate it will be used as the input
MFI curve highlights when you drag the applied indicator over it
Step 5: Drop the Indicator
- Release the mouse button over the highlighted curve
- Stockalyze will automatically apply the new indicator using the highlighted indicator as input
- The configuration dialog will appear, allowing you to customize parameters if needed
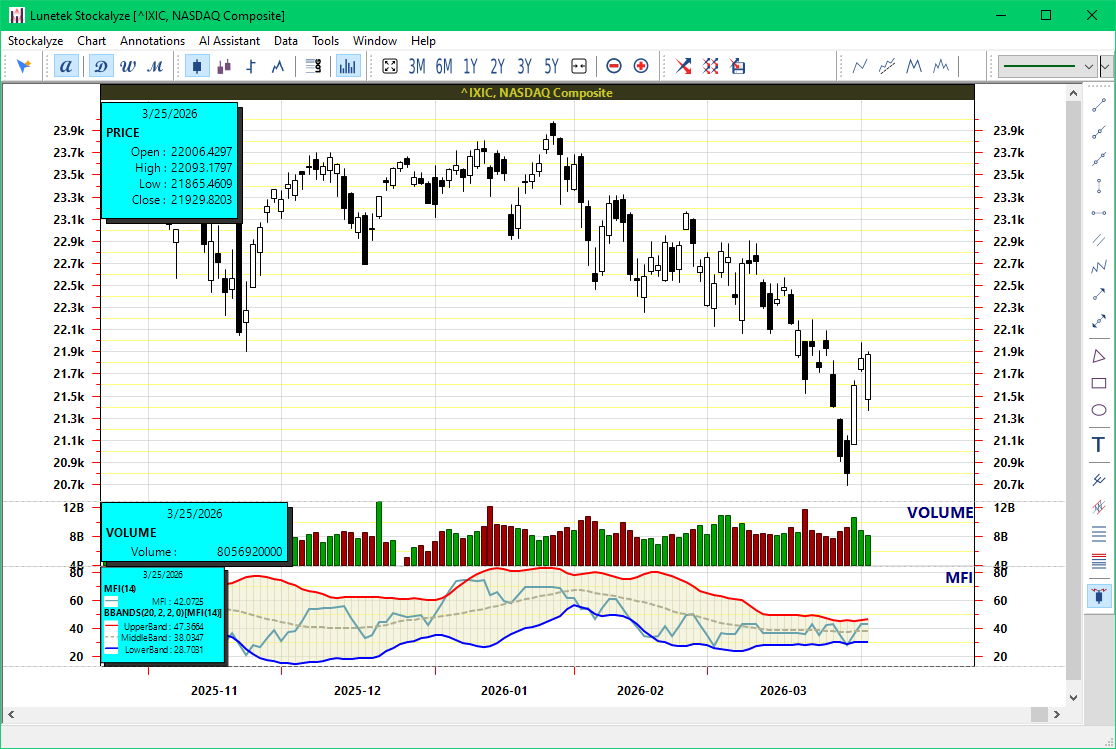
Result: Bollinger Bands applied to MFI data
Drag-and-Drop Tips
- Be Precise: Make sure you're dragging over the actual indicator curve for best results
- Watch for Highlighting: The highlight indicates where the indicator will be applied
- Adjust Configuration: After dropping, the configuration dialog appears so you can fine-tune parameters
- Multiple Applications: You can repeat this process to create multi-level indicators (e.g., MA on Bollinger Bands on RSI)
Method 2: Creating Composite Indicators by Configuration
The configuration method allows you to create composite indicators more explicitly by selecting the input series in the Indicator Configuration Dialog. This method is particularly useful when:
- Creating composite indicators for Trading Systems, not just for charts
- You want explicit control over which indicator output is used as input
- You prefer a menu-driven approach over drag-and-drop
Step-by-Step: Configuration Method
Step 1: Create Base Indicator
- Add your base indicator first (e.g., RSI)
- Configure it as desired and click OK
Step 2: Add Applied Indicator
- Press Ctrl+1 or go to Chart → Add Indicator...
- Select your applied indicator (e.g., BBANDS)
- Click OK to open the configuration dialog
Step 3: Configure Input Series
- In the Indicator Configuration Dialog, look for the "Input Series" section
- Instead of selecting "Close" (price data), look for a dropdown that shows available indicators
- Select the base indicator output (e.g., "RSI")
- Adjust other parameters as needed (period, colors, etc.)
- Click OK to apply the composite indicator
Advanced Configuration Tips
- Select Specific Series: If the base indicator has multiple outputs (e.g., MACD has MACD line, signal line, histogram), the dialog may let you select which one to use
- Multiple Indicators: You can apply the same indicator to multiple base indicators for comparison
- Chaining: You can create 3+ level indicators if needed
Popular Composite Indicator Combinations
Volatility Refinement
Bollinger Bands on RSI
- Applies volatility analysis to momentum data
- Helps visualize when RSI becomes volatile (potential breakout)
- Useful for identifying squeeze before moves
Trend Smoothing
Moving Average on MACD Histogram
- Smooths the MACD histogram for clearer trend direction
- Reduces false signals from noisy histogram
- Creates a smoother histogram line for better visual analysis
Double Momentum Analysis
Stochastic on RSI
- Applies oscillator logic to momentum analysis
- Helps identify overbought/oversold conditions of RSI itself
- Can reveal divergences that single indicators miss
Volume-Weighted Momentum
Moving Average on Money Flow Index
- Smooths volume-weighted momentum signals
- Creates clearer entry/exit points
- Reduces noise in volume-based analysis
Creating Composite Indicators for Trading Systems
Composite indicators aren't limited to charts. You can create them in Trading Systems as well by specifying which indicator's output should feed into another. This allows you to build automated trading systems based on composite indicator logic.
Best Practices for Composite Indicators
- Start Simple: Begin with two indicators before creating complex chains
- Test First: Build composite indicators on historical chart data before relying on them
- Understand Each Component: Know what each underlying indicator measures
- Avoid Over-Complexity: Adding too many layers can create lag and reduce responsiveness
- Save as Template: Once you create a useful composite indicator setup, save it as an Indicator Template
- Document Your Logic: Remember why you chose this combination for future reference
Related Topics
- Stock Chart Guide — Overview of all charting features
- Technical Indicators — Learn about available indicators
- Indicator Templates — Save composite indicator setups for reuse
- Indicator Configuration Dialog — Detailed configuration help
- Trading Systems — Build automated systems with composite indicators
 Stockalyze Help Manual